

Abstract
In this paper, we present the results of an investigation of the influence of fabrication conditions on the structure and magnetic properties of Nd10.5−xFe83.5−yCoxNbyB6 (x=0–6; y=1.5–3) nanocomposites prepared by melt-spinning combined with annealing. By changing the quenching rate (by varying the tangential velocity of the copper wheel from 10 m s−1 to 40 m s−1), one can select a suitable velocity to obtain an alloy that has good, hard magnetic behavior without annealing. However, the hard magnetic behavior of the alloy is better and more stable when the alloy is quenched at a high rate to create an amorphous state and subsequently annealed in the range of 650–800 °C for 10 min. The results also show that the Co concentration has an important effect on the structure and magnetic properties of the alloys.
Export citation and abstract BibTeX RIS

Content from this work may be used under the terms of the Creative Commons Attribution-NonCommercial-ShareAlike 3.0 licence. Any further distribution of this work must maintain attribution to the author(s) and the title of the work, journal citation and DOI.
1. Introduction
The Nd–Fe–B-based nanocomposites have been widely studied since they were discovered [1]. This kind of material consists of exchange-coupled hard and soft magnetic phases. The hard magnetic phases provide high anisotropy and consequently high coercivity, while the soft ones provide large saturation magnetization. Therefore, they have been predicted to have the highest maximum energy product (BH) max (above 100 MGOe) due to the strong inter-grain exchange coupling at the nanometer scale. There are two ways to control the formation of the nanocrystallites in the alloys prepared by a rapid quenching method. One is based on the variation of the annealing conditions for the over quenched alloys, which are amorphous in the as-quenched state. The other is based on the change in the quenching rate of the melted alloys. The optimal annealing condition and quenching rate depend on the composition of the alloy. The addition of elements such as Dy, Pr, Nb, Cu and Co is one means of improving the parameters of the hard magnetic behavior and fabrication technology of the material [2–6]. The reported investigations showed that Nb is commonly added to the materials because it can surround the crystallites to prevent their growth. In accordance with our previous results [7, 8], the optimal nanostructure of the materials can be obtained with a Nb concentration from 1.5 to 3 at%. To enhance the Curie temperature of the material, the addition of Co is the most suitable way because Co can substitute for Fe in the Nd 2(Fe,Co)14 B phase [3]. Moreover, Co can improve the glass-forming ability (GFA) and remanence of the material [8, 9].
In this work, we investigate the influence of Co and fabrication technology on the structure and magnetic properties of Nd 10.5−x Fe 83.5−y Co x Nb y B 6 (x=0, 2, 4 and 6; y=1.5 and 3) alloys by varying the quenching rate and annealing conditions.
2. Experimental
The pre-alloys with nominal compositions of Nd 10.5−x Co x Fe 83.5−y Nb y B 6 (x=0, 2, 4 and 6; y=1.5 and 3) were first prepared by an arc-melting method to ensure their homogeneity. The melt-spinning method with various quenching rates was then used to fabricate the ribbon samples from the pre-alloys. The variation in the quenching rate was performed by changing the tangential velocity (v) of the copper wheel. The different values of 10, 20 and 40 m s −1 of v were applied to obtain the melt-spun ribbons. The annealing process was performed at various temperatures from 650 °C to 800 °C for 10 min in Ar gas. The structure of the samples was investigated by the powder x-ray diffraction (XRD) method. The magnetic properties of the samples were characterized by magnetic hysteresis and thermomagnetization measurements.
3. Results and discussion
In order to investigate the Nd–Fe–Co–Nb–B nanocomposites systematically, we divided them into several series. In each series, the Nb concentration was fixed (at 1.5 and 3 at%), while the Co concentration was varied from 0 to 6 at%. First, we present the results obtained on the series with a Nb concentration of 3 at%. With Nd 10.5−x Fe 80.5 Co x Nb 3 B 6 (x=0, 2, 4 and 6) alloys, a wide range of velocity of roller was applied to this alloy to study the effect of quenching rate on phase formation and the magnetic properties of the material. Figure 1 presents XRD of Nd 10.5−x Fe 80.5 Co x Nb 3 B 6 (x=0, 2, 4 and 6) ribbons with v from 10 to 40 m s −1. The results of structure analyses show that the phase formation clearly depends on the concentration of Co and variation in the tangential velocity of the copper wheel (figure 1). Most of the diffraction peaks of the XRD patterns correspond to Nd 2(Fe,Co)14 B and α-Fe phases. With increasing Co concentration, the diffraction peaks of the 2:14:1 phase degrade fast, while those of the α-Fe are gradually dominated. The total crystalline fraction in the ribbons depends on the Co concentration. Without Co addition (x=0), the diffraction peaks appear in all samples even with the highest quenching rate (v=40 m s −1). With the Co concentration in the range of 2–6 at%, the crystalline fraction of the alloy is reduced considerably with v=10 and 20 m s −1 and can be neglected with v=40 m s −1. Thus, with appropriate concentrations of Co, the glass forming ability (GFA) of the alloy can be improved considerably, i.e. the critical quenching rate of the alloy is reduced. This has significant meaning in the fabrication technology of the material.

Figure 1 XRD patterns of as-quenched Nd 10.5−x Co x Nb 1.5 Fe 82 B 6 (x=0, 2, 4 and 6) ribbons with v=10 (a), v=20 (b) and v=40 m s −1 (c).
It should be noted that the coercivity of the alloys is strongly dependent on the velocity of the copper wheel. To investigate the influence of the quenching rate on the magnetic properties of the alloys, the hysteresis loops were measured (figure 2).
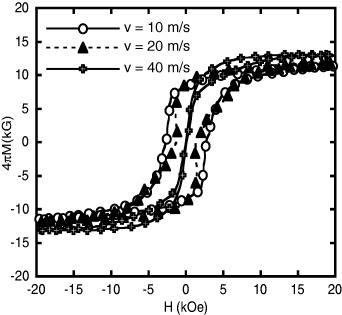
Figure 2 Hysteresis loops of as-quenched Nd 8.5 Fe 80.5 Co 2 Nb 3 B 6 (x=2) ribbons with variation in quenching rate.
The coercivities of the alloy with various quenching rate are shown in table 1. The results show that the Co concentration clearly influences the magnetic properties of the alloy. Without Co addition (x=0), the highest coercivity is about 10.5 kOe with v=20 m s −1. When the concentration of Co increases, H c of the alloy is gradually reduced. Specifically, the alloys reveal low coercivity with v=40 m s −1. This is due to a decrease in Ndb concentration. As a consequence, the crystalline fraction of the 2:14:1 phase in the alloy is degraded and those of the α-Fe and amorphous phases are dominated.
Table 1. Coercivities, Hc (kOe), of the as-quenched Nd 10.5−x Fe 8.5 Co x Nb 3 B 6 (x=0, 2, 4 and 6) ribbons with v=10, 20 and 40 m s−1.
| 0 | 4.6 | 10.5 | 5.9 |
| 2 | 2.8 | 1.4 | 0.4 |
| 4 | 2.7 | 0.6 | 0.2 |
| 6 | 0.7 | 0.07 | 0.02 |
To investigate the influence of annealing conditions on the magnetic properties of the alloys, the samples with the highest quenching rate of 40 m s −1 (the lowest amorphous-to-crystalline transformation during quenching process) were selected for annealing. The annealing temperature, T a , was varied from 650 °C to 800 °C (this is a crystalline temperature region of Nd 2 Fe 14 B hard magnetic phase) and the annealing time, t a , was selected for 10 min. Figure 3 presents hysteresis loops of the annealed Nd 10.5−x Fe 80.5 Co x Nb 3 B 6 (x=0, 2, 4 and 6) ribbons with v=40 m s −1. We can realize that the annealing temperature clearly influences the magnetic properties of the alloys. The hysteresis loop of all of the samples greatly expands after annealing at all selected temperatures. That means that the hard magnetic phase was formed in the annealed alloys resulting in an increase in coercivity of the material. The shape of all of the hysteresis loops of the annealed samples is similar. However, their squareness as well as the coercivity of the alloys vary from one to another, depending on the concentration of Co. The coercivity of the samples was clearly changed, particularly with the Co concentration in the range of 2–4%. It is noted that the saturation magnetization of the alloy is considerably increased with increasing concentration of Co. It is essential to enhance the energy product of the material.
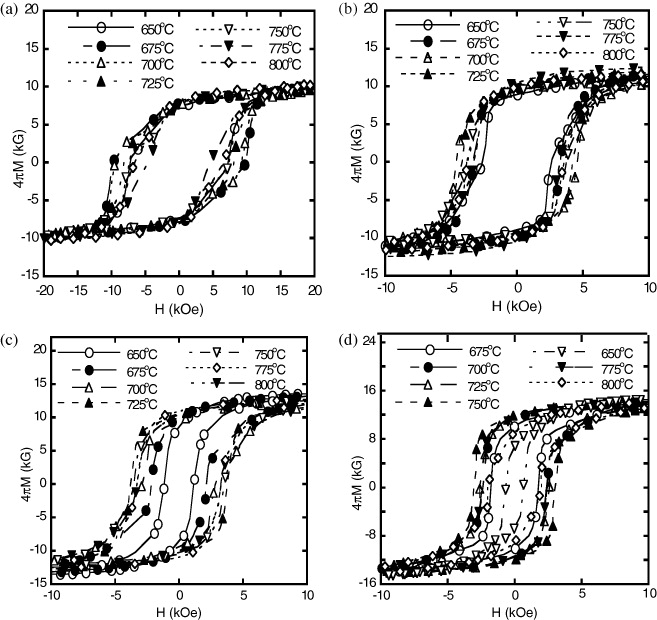
Figure 3 Hysteresis loops of Nd 10.5−x Fe 80.5 Co x Nb 3 B 6 ribbons with x=0 (a), 2 (b), 4 (c), and 6 (d) annealed at various temperature for 10 min.
From these hysteresis loops, the coercivity of the samples was determined (table 2). We can see that the coercivity of all of the samples except the sample with x=0 is strongly increased in comparison with the as-quenched ones. The highest values of the alloys with Co concentrations of 0, 2, 4 and 6% are found to be 9.7, 4.5, 3.8 and 3 kOe, respectively.
Table 2. Coercivities, H c , (kOe) of the Nd 10.5−x Fe 80.5 Co x Nb 3 B 6 (x=0, 2, 4 and 6) alloys annealed at various temperatures, T a , for 10 min.
| 0 | 7.8 | 9.7 | 9.5 | 8.0 | 7.3 | 6.6 | 4.4 |
| 2 | 2.4 | 3.3 | 4.5 | 4.2 | 3.7 | 3.6 | 3.3 |
| 4 | 1.2 | 2.2 | 2.9 | 3.9 | 3.6 | 3.3 | 3.1 |
| 6 | 0.6 | 1.8 | 2.5 | 2.6 | 3.0 | 2.5 | 1.9 |
To determine the variation trend of coercivity H c , we plotted the dependence of H c on the annealing temperature (figure 4). We can see that coercivity decreases with increasing Co concentration. Specifically, each of the alloys with different concentrations of Co has its own optimal annealing temperature, at which the microstructure of the alloys is formed optimally leading to the best performance of the material. For example, the alloy with x=0 has the optimal annealing temperature of 675 °C, while the alloy with x=2 has an optimal annealing temperature of 700 °C. This is explained as due to a reduction in concentration of the rare earth (Nd concentration) leading to a decrease in the hard magnetic phase fraction. On the other hand, Co can substitute for Fe in the Nd 2 Fe 14 B phase and drop the crystalline magnetic anisotropy of this hard magnetic phase and simultaneously enhance the crystallization temperature of the crystalline phase in the alloy.
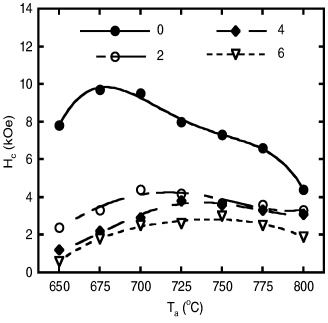
Figure 4 Dependence of coercivity, H c , on the annealing temperature (T a ) of the Nd 10.5−x Fe 80.5 Co x Nb 3 B 6 (x=0, 2, 4 and 6).
The values of maximum energy product (BH) max of the annealed alloys are listed in table 3. We can see that some of the samples with high a Co concentration have low coercivity H c , but they still have a relatively large maximum energy product. This can be explained as a result of the saturation magnetization as well as remanent magnetization of the alloys increasing remarkably with increasing Co concentration. On the other hand, the squareness of the hysteresis loops is also improved considerably with the appearance of Co. Therefore, with a Co concentration from 2 to 4%, the samples have lower coercivity, but they have a larger maximum energy product. (BH) max of the alloy reaches a maximum value of 14.7 MGOe with a Co concentration of 4% at an annealing temperature of 725 °C.
Table 3. Maximum energy products, (BH) max , (MGOe) of the Nd 10.5−x Fe 80.5−x Co x Nb 3 B 6 (x=0, 2, 4 and 6) alloys annealed at various temperatures T a for 10 min.
| 0 | 8.2 | 10.9 | 10.1 | 8.5 | 8.0 | 7.6 | 7.3 |
| 2 | 10.2 | 12.2 | 14.0 | 12.7 | 11.8 | 12.0 | 10.7 |
| 4 | 7.7 | 11.5 | 13.2 | 14.7 | 13.2 | 11.8 | 8.9 |
| 6 | 5.6 | 11.1 | 12.0 | 12.5 | 13.1 | 10.9 | 5.2 |
In order to investigate the influence of the Nb concentration on the structure and magnetic properties of the alloys, we reduce the concentration of Nb from 3 to 1.5 at%. The Nd 10.5−x Fe 82 Co x Nb 1.5 B 6 ribbons were prepared with v=40 m s −1. The results show that the formation of magnetic phases and the influence of Co concentration on the structure and magnetic properties of this series are similar to those of the series with a Nb concentration of 3 at%.
To enhance the hard magnetic property of the alloys, the Nd 10.5−x Fe 82 Co x Nb 1.5 B 6 (x=0, 2, 4 and 6) ribbons were annealed from 650 to 800 °C for 10 min. The results clearly show the dependence of the magnetic properties of this alloy on the annealing temperature. The hysteresis loop of all of the samples greatly expands after annealing. This means that the hard magnetic phase was formed in the annealing process. Figure 5 representatively shows hysteresis loops of the Nd 10.5−x Fe 82 Co x Nb 1.5 B 6 (x=0, 2, 4 and 6) ribbons annealed at 725 °C for 10 min. It is clearly that the Co concentration has a strong influence on the magnetic properties of the alloy.
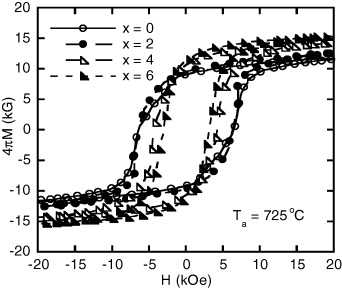
Figure 5 Hysteresis loops of Nd 10.5−x Fe 82 Co x Nb 1.5 B 6 (x=0, 2, 4 and 6) ribbons annealed at 725 °C for 10 min (b).
The dependence of coercivity H c of Nd 10.5−x Fe 82 Co x Nb 1.5 B 6 (x=0, 2, 4 and 6) ribbons on the annealing temperature is shown in figure 6. The results show that all of the samples have an optimal annealing temperature at about 725 °C. In general, H c decreases gradually with increasing Co concentration.

Figure 6 Dependence of coercivity, H c , on annealing temperature (T a ) of the Nd 10.5−x Fe 82 Co x Nb 1.5 B 6 (x=0, 2, 4 and 6) ribbons.
The values of the maximum energy product (BH) max of the annealed alloy are listed in table 4. We can see that some of the samples have rather low coercivity H c , but they still have a relatively large maximum energy product. Specifically, the sample with a Co concentration of 2% has a lower coercivity than the one without Co− addition, but it owns a larger maximum energy product. (BH) max of this alloy reaches a maximum value of 14.5 MGOe at the annealing temperature of 725 °C.
Table 4. Maximum energy products, (BH) max ,(MGOe) of the Nd 10.5−x Fe 82 Co x Nb 1.5 B 6 (x=0, 2, 4 and 6) alloys annealed at various temperatures T a for 10 min.
| 650 | 11.3 | 12.5 | 8.8 | 0.7 |
| 675 | 11.8 | 12.9 | 9.2 | 3.8 |
| 700 | 12.9 | 13.2 | 9.5 | 6.2 |
| 725 | 14.1 | 14.5 | 10.5 | 9.6 |
| 750 | 9.0 | 11.7 | 9.6 | 5.2 |
Figure 7 shows thermomagnetization curves of the Nd 10.5−x Fe 82 Co x Nb 1.5 B 6 (x=0, 2, 4 and 6) alloys before and after annealing. The difference from one to another of the thermomagnetization curves in is due to the formation of the magnetic phases in the alloy depending on the Co concentration. There are three main magnetic phases, which can contribute to the thermomagnetization curves: amorphous, soft and hard magnetic phases. The amorphous phase causes transitions at rather low temperatures for the as-quenched samples (figure 7(a)). As for the annealed ribbons, the higher the Co concentrations, the higher the temperatures they have (figure 7(b)). In this kind of material, the 2:14:1 hard magnetic phase determines the Curie temperature (T C ) of the material. Without Co addition (x=0), the alloy has T C ∼ 585 K (this is the Curie temperature of the 2:14:1 hard phase). T C of the alloy increases up to ∼650 K with increasing Co concentration. This increase in Curie temperature is supposedly due to substitution of Fe for Co in the Nd 2 Fe 14 B hard magnetic phase.
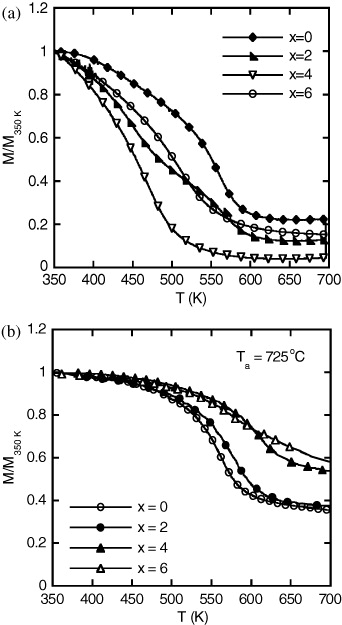
Figure 7 Thermomagnetization curves of Nd 10.5−x Co x Nb 1.5 Fe 82 B 6 ribbons before and after annealing.
4. Conclusion
The influence of fabrication conditions on the structure and magnetic properties of Nd 10.5−x Fe 83.5−y Co x Nb y B 6 (x=0, 2, 4 and 6; y=1.5 and 3) was investigated systematically. The optimal nanostructure resulting in the best performance of the materials can be obtained with an appropriate quenching rate and thermal treatment. With a Co concentration from 2 to 4%, Co can simultaneously enhance the glass-forming ability (GFA) and maximum energy product (BH) max of the material. Coercivities higher than 9 kOe and maximum energy products larger than 14 MGOe were achieved in this system.
Acknowledgments
This work was supported by the National Foundation for Science and Technology Development (NAFOSTED) of Vietnam under grant number 103.02.40.09. Part of the work was done at the National Key Laboratory for Electronic Materials and Devices, Institute of Materials Science.