


Abstract
In the present research, a statistical model was designed for optimizing three process variables for manufacturing nickel nanoparticles (NiNPs) using honey as bio-supported reducing agent. Characterisation of nanoparticles was performed using UV–vis spectrophotometer, nanoparticle size analysis was conducted by laser diffraction method and transmission electron microscopy (TEM) was used for morphological studies. Fourier transform infrared spectroscopy (FTIR) analysis was done for identifying the chemical nature of the capping agent deposited on the nanoparticle and energy dispersive x-ray (EDX) analysis was carried out for element determination. XRD analysis was used for the crystallographic determination. Characterisation by all the methods pointed to the crystalline nature of the NiNPs with a mean diameter of 31 nm.
Export citation and abstract BibTeX RIS
1. Introduction
Nanoparticles are nowadays finding vast applications due to their tremendous surface area in different fields such as microelectronics, catalysis, etc. Recently many techniques were developed that integrate green chemistry principles and nanotechnology which exploit physical as well as chemical routes for the synthesis of nanoparticles for specific applications [1–8]. Nanoparticle synthesis by several chemicals as well as physical methods involves tedious and environmentally challenging techniques such as sputtering, gas evaporation, sol-gel method, coprecipitation, microemulsion, etc [9–22].
There is a great demand to develop non-toxic and environment-friendly techniques for the synthesis of nanoparticles. One of the many ways is to explore the biological world in nature for clues which have a unique ability to control the structural properties of the inorganic crystals [23]. Scientists have strived to form NiNPs with uniform particle size and narrow distribution, as it shows remarkable catalytic and magnetic properties [21, 22]. These nanoparticles were synthesised by chemical reduction technique using nickel salts as precursor and surfactants as coating agents [22, 24–29].
The optimum conditions for metal nanoparticle synthesis can be predicted using mathematical methodology. These methods also help us in reducing cost and time along with predictable results [22].
In this work, NiNPs were synthesised by chemical reducing the salt using honey as a reducing agent to avoid toxic chemicals and provide a green route to synthesis. The influence of reaction parameters such as temperature, reducing agent concentration, and pH was scrutinized with the help of response surface methodology (RSM). The obtained particles were evaluated using UV–visible spectrophotometer, nanoparticle size analyzer, TEM, EDX, XRD, and FTIR.
2. Experimental procedure
2.1. Materials
Honey of Phondaghat brand was bought from a local medical shop in Mumbai, India. Nickel chloride hexahydrate (NiCl2 · 6H2O Molecular Weight, 237.69 gm), sulfuric acid and sodium hydroxide were purchased from S. D. Fine-Chem Ltd, Mumbai, India.
2.2. Synthesis of NiNPs
Using distilled water, 0.01 M Nickel chloride solution of 100 ml was taken in the flask. In this salt solution, honey was added for two hours at 70 rpm under continuous stirring using shaker-bath instrument of Rossari Labtech, Mumbai, India. The synthesis was performed according to the design of experiment 6.0.10 CCD model to investigate the influence of three parameters temperature, the quantity of honey and pH. 0.1 N of sodium hydroxide and 0.1 N of sulphuric acid solutions were used to maintain the pH. During the synthesis process, change in color was observed from sea green to colloidal dull yellow confirming the formation of nanoparticles. The solution was filtered after complete reduction of the nickel chloride and stored for characterisation.
2.3. Experimental design
RSM was used as per central composite design (CCD) for optimization of parameters to evaluate the influence of reaction parameters such as reducing agent concentration, temperature, and pH on absorbance of the solution after each experimental run as a response which is shown in table 1.
Table 1. Central composite experimental design for the synthesis of NiNPs with the response.
| Absorbance at 333 nm | |||||
|---|---|---|---|---|---|
| Run | [A] Temperature (°C) | [B] pH | [C] Concentration of reducing agent (g/100 ml) | Experimental | Predicted |
| 1 | 75 | 5 | 5 | 0.2174 | 0.267264 |
| 2 | 50 | 3 | 2.5 | 0.1024 | 0.112456 |
| 3 | 100 | 3 | 7.5 | 0.6469 | 0.624976 |
| 4 | 100 | 7 | 7.5 | 0.5527 | 0.549632 |
| 5 | 75 | 7 | 5 | 0.2944 | 0.231572 |
| 6 | 75 | 5 | 5 | 0.2456 | 0.267264 |
| 7 | 75 | 5 | 5 | 0.2447 | 0.267264 |
| 8 | 50 | 5 | 5 | 0.3767 | 0.359264 |
| 9 | 100 | 5 | 5 | 0.4054 | 0.402764 |
| 10 | 100 | 7 | 2.5 | 0.0909 | 0.124512 |
| 11 | 75 | 3 | 5 | 0.2022 | 0.244716 |
| 12 | 100 | 3 | 2.5 | 0.1323 | 0.133456 |
| 13 | 75 | 5 | 5 | 0.2553 | 0.267264 |
| 14 | 75 | 5 | 5 | 0.3207 | 0.267264 |
| 15 | 50 | 3 | 7.5 | 0.5276 | 0.500976 |
| 16 | 75 | 5 | 2.5 | 0.1187 | 0.048354 |
| 17 | 75 | 5 | 7.5 | 0.4051 | 0.455174 |
| 18 | 75 | 5 | 5 | 0.2722 | 0.267264 |
| 19 | 50 | 7 | 2.5 | 0.1323 | 0.161512 |
| 20 | 50 | 7 | 7.5 | 0.4776 | 0.483632 |
2.4. Characterisation
UV–Visible spectroscopy analysis of NiNPs produced was carried out periodically at fixed time interval on UV–vis spectrophotometer (UV-1800 ENG 240 V, Shimadzu, Japan). Nanoparticle size analyzer (SALD 7500 nano, Shimadzu, Japan) was used to assess the particle size distribution and particle size of nanoparticles. Morphology of the nanoparticle surface was studied with the help of TEM (Phillips TEM-200 Supertwin STEM, accelerating voltage-200 kV, resolution-0.23 nm). Crystallography of the nanoparticles was achieved using x-ray diffractometer (Shimadzu XRD-6100, Japan) with CuKα radiation from 10° to 80°. Chemical group on NiNPs was identified using FTIR (FTIR 8400S Shimadzu, Japan) and analysis of elements was performed in the Na-U channel using EDAX (EDX-720, Shimadzu, Japan).
3. Results and discussion
3.1. Optimization analysis
From table 1, results showed considerable variation in the NiNPs biosynthesis. Treatment run number 3 gave optimized conditions of 100 °C temperature, pH 3 and 7.5 g/100 mL concentration of reducing agent for maximum absorbance (0.6469) among all the runs.
ANOVA results are shown in table 2. The significance and interaction strength of each parameter were checked using P-values. The P-value of NiNPs synthesis was 0.0000176 indicating statistical significance of the obtained model. It can be seen from the probability values of the coefficient that out of the three parameters analyzed, C (reducing agent concentration) showed maximum influence between the three parameters, signifying that 99% of the model is dependent on this parameter. On the other hand, linear and quadratic outcomes of temperature (A) and pH (B) did not show a significant effect on NiNPs biosynthesis. However, the 'lack of fit' value was 0.1402 which proved that 'lack of fit' was not significant.
Table 2. Analysis of variance for CCD model for optimization.
| Source | Sum of squares | The degree of freedom (df) | Mean square | F Value | P-value (Prob > F) |
|---|---|---|---|---|---|
| Model | 0.47 | 9 | 0.052 | 22.39 | 0.0000176 |
| A | 4.477E-003 | 1 | 4.477E-003 | 1.92 | 0.1959 |
| B | 4.032E-004 | 1 | 4.032E-004 | 0.17 | 0.6863 |
| C | 0.41 | 1 | 0.41 | 177.33 | <0.0001 |
| Residuals | 0.023 | 10 | 2.331E-003 | ||
| Lack of fit | 0.017 | 5 | 3.441E-003 | 2.82 | 0.1402 |
| Pure error | 6.109E-003 | 5 | 1.222E-003 | ||
| Total | 0.49 | 19 | |||
| R2 | 0.9527 | ||||
| Adj R2 | 0.9102 |
The small value of R2 (coefficient of determination) showed less effect of the dependent variables in the model. The R2 value of the model was 0.9527, showing that the regression model was in consonant with the true behavior of the system. The value of the adjusted determination coefficient (Adj. R2 = 0.9102) was more than 0.9, justifying the high significance of the model. Thus, the proposed model was considered to be reasonable for the present setup [30].
Polynomial equation of second-order was suggested to compute the optimum values of the input parameters for determining maximum NiNPs biosynthesis as per equation (1).
The interaction effects are shown by taking the graph of the response surface curves (figure 1) where the two other parameters were varied while one of the parameters was kept constant at an optimum value. From graphs, we can say that the higher yield of the NiNPs was directly proportional to the reaction temperature and concentration of reducing agent but inversely proportional to the pH (figure 1).

Figure 1. Three-dimensional response surface (A)–(C) showing the interactive effects of independent variables on the biosynthesis of NiNPs.
Download figure:
Standard image High-resolution imageIn addition, verification of the optimized study was done practically to compare with the predicted data. The experimental absorbance value was 0.6469 at λmax = 333 nm which was in agreement with predicted value (0.624976) as per the model. Therefore, the optimized values of the process parameters for NiNPs biosynthesis using honey were 100 °C temperature, pH 3.7 and 7.5 g of reducing agent.
3.2. UV–vis spectrophotometer
The absorption spectra of NiNPs for different time scales are shown in figure 2. It is observed that absorbance increased as the reaction time progressed leading to a higher concentration of NiNPs. The peak around 320–350 nm indicated the presence of NiNPs [31–33].

Figure 2. UV-Vis absorption spectrum of NiNPs solutions at different time intervals.
Download figure:
Standard image High-resolution imageFrom figure 3, change in color was observed from sea green to colloidal dull yellow for the biosynthesis of NiNPs at optimum reaction conditions. Due to a phenomenon known as plasmon absorbance, the distinctive colors of colloidal nickel were observed [34]. However, such color changes might also occur due to the variation in the nature, size, and shape of the metal nanoparticles [35].

Figure 3. Images of NiNPs solutions taken out at different time intervals.
Download figure:
Standard image High-resolution image3.3. TEM and nanoparticle size analyzer
The TEM image (figure 4(A)) shows that the particles were predominantly ellipsoidal in shape. Agglomeration of nanoparticles was observed which could be due to possible sedimentation after a certain period of time. It can also be noted from the images that the particles were somewhat coated with a thin layer, which could be the capping components from honey [36].
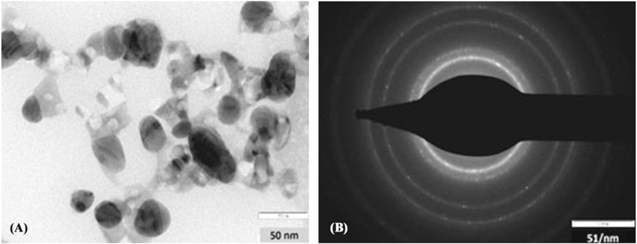
Figure 4. (A) TEM image and (B) SAED pattern of NiNPs.
Download figure:
Standard image High-resolution imageIn the selected area electron diffraction pattern (SAED) ring-like diffraction pattern was observed which indicated the crystalline nature of the synthesised nanoparticles as shown in figure 4(B). The diffraction rings correspond to the different crystallographic planes of elemental nickel [37].
TEM analysis gave the size of nanoparticles in the range of 12 to 45 nm (average diameter 28 nm) (figure 4(A)). Same particle size range was obtained using nanoparticle size analyzer with 31 nm being median particle size as shown in figure 5.

Figure 5. Particle size analysis of NiNPs.
Download figure:
Standard image High-resolution image3.4. XRD
The XRD measurement of NiNPs (figure 6) showed four distinct diffraction peaks at 37.6378°, 43.8638°, 64.2226° and 77.3990° representing (010), (111), (200) and (220) Miller indices respectively which are catalogued in Joint Committee on Powder Diffraction Standards (JCPDS), file No. 04–0850 [31, 38].

Figure 6. XRD pattern of NiNPs.
Download figure:
Standard image High-resolution imageThe observed peaks revealed that the obtained particles are face-centered cubic [23] and showed crystallinity of 20.23% which is supported by the sharpness of the major peak (111). The peaks get shifted towards lower diffraction angle (2θ) by a value of 0.6362 as against a bulk value (2θ = 44.5; JCPDS 04-0850) indicating the increase in lattice constant [39]. The 32 nm particle size of NiNPs was estimated using Debye–Scherrer's formula [40, 41]. The crystal size calculated by different methods is tabulated in table 3.
Table 3. Particle size of NiNPs as calculated by different methods.
| Crystal size in nm | ||
|---|---|---|
| Debye–Scherrer formula | Laser diffraction method | TEM |
| 32 | 31 | 28 |
3.5. EDX
EDX spectroscopy analysis gave a sharp signal in the nickel region thus the formation of NiNPs was confirmed (figure 7). Due to surface plasmon resonance, the optical absorption peak at 7.5 keV was shown by metallic nickel nanocrystals [42].

Figure 7. EDX spectrum of NiNPs synthesised using honey.
Download figure:
Standard image High-resolution image3.6. FTIR
Figure 8 shows, the FTIR spectrum of the colloidal NiNPs and honey in order to establish possible reducing as well as capping agents.

Figure 8. FTIR spectrum of NiNPs colloid and honey.
Download figure:
Standard image High-resolution image
From figure 8, the broad band observed around 3300 cm−1 was attributable to the O-H stretching of the honey components. The peaks such as small band located at 2932 cm−1 (C–H stretch of carboxylic acids and amine stretching band present in free amino acids), 1043 cm−1 (C–O stretch occurring in the C–OH group) and 1254 cm−1 (C–C stretch of carbohydrates). Similarly, the absorption band noted at 1027–1045 cm−1 can be related to the C-O stretching of the glucose or sucrose molecules. Thus, the FTIR analysis indicates the presence of glucose, fructose and other honey components in the samples of NiNPs. It is well known that proteins are capable of binding to nanoparticles either through carboxylate ions or free amine groups of the amino acid residues. But it is possible that other bioorganic compounds that exist in honey can cause the reduction of nickel ions and its stabilization through surface capping [36].
4. Conclusion
Ellipsoidal NiNPs with nano size can be synthesised by green synthesis method using honey as a stabilizing and reducing agent. The presence of carbohydrates and proteins in the honey was responsible for the reducing and coating phenomena. The particle size varied between 28–31 nm as measured by different techniques. The particle size of the nanoparticles was confirmed by nanoparticle size analyzer, TEM and XRD techniques. This method may offer an alternate eco-friendly route for the synthesis of NiNPs although the quantity of honey required is more than the chemical reducing agents.
Acknowledgments
Authors are thankful to World Bank funded TEQIP-II and FIST-DST project, Govt. of India for making the machinery available for this research project.