

Abstract
Epigallocatechin gallate (EGCG), a natural antioxidant present in green tea is a remedy for the treatment of numerous diseases linked to oxidative stress. The aim of the present study was to prepare nanoformulation of EGCG alone and along with piperine into a protein nanocarrier and to study their effect on in vitro antioxidant, haemolytic and anticancer activities. Anti-solvent precipitation method and full-factorial  design expert software was used for the synthesis and optimization of EGCG loaded nanosuspension (EGCG NS) and EGCG-piperine nanocomplex (EGCG-Pip NC). The optimized nanosuspensions showed spherical morphology and stable zeta potential. Although an increase in antioxidant potential and a decrease in the haemolytic activity of EGCG were observed due to nanoencapsulation, the EGCG nanoformulation(s) displayed higher anti-cancer activity against various cell lines (HL60, SCC40, MCF7, HeLa and Colo205) in comparison to pure EGCG.
Export citation and abstract BibTeX RIS

Original content from this work may be used under the terms of the Creative Commons Attribution 3.0 licence. Any further distribution of this work must maintain attribution to the author(s) and the title of the work, journal citation and DOI.
1. Introduction
Nanotechnology enables the manipulation of materials at nanoscale and has the potential to enhance sensitivity, selectivity and to lower the cost of a diagnosis [1]. Nano-sized drug delivery technology is growing at a rapid pace due to its immense potential in therapeutic applications. Biopolymer-based nanoparticles including protein nanoparticles have gained lot of attention in recent years due to their fascinating properties over other synthetic biomaterials. These properties include biodegradable and biocompatible nature, high drug loading efficiency, ease of availability, non-immunogenicity, low toxicity, high nutritional value and high stability [2, 3]. The amphiphilic nature of proteins allows them to interact well with both the drug and solvent which make them ideal material for nanoparticle synthesis [4]. Another unique property exhibited by proteins is the presence of high number of functional groups which can be easily altered for surface modifications and thus allowing the interaction between drugs and targeting ligands [5]. Moreover, higher molecular weight of synthetic polymers allow them to accumulate into body resulting in forming toxic products, whereas proteins are easy to metabolize by the intestinal enzymes into simple peptides [6]. Thus, protein based nanocarriers are considered one of the promising material for drug and gene delivery due to their unique properties.
Nanoencapsulation of bioactive compound in biopolymer-based nanoparticles offers promising solution to drug delivery specifically to tumors either passively by enhanced permeability and retention (EPR) effect or via active targeting. Moreover, surface modification, size and shape of nanoparticles directly influenced their cellular uptake, which was accompanied by endocytosis in the cell [7]. The encapsulation in suitable matrix also enhances the food quality by altering its texture, taste, and stability by improving shelf life. Till date, many nutraceutical bioactive compounds like vitamins, enzymes and antioxidants have been encapsulated into micro/nanocarrier resulting into material with improved stability and functionality profile [8]. Different food proteins like zein, whey protein, egg white,  lactoglobulin, gelatin, collagen, casein, albumin and soy glycinin have been studied as encapsulating carrier [9]. The phase separation technique was commonly employed for the preparation of nanoparticles using water-insoluble proteins (corn zein and wheat gliadin). Among the water insoluble proteins, zein has gained enormous attention as drug delivery carrier due to its desirable attributes shown by zein such as biocompatibility, biodegradability, hydrophobicity, unique solubility, low toxicity and it's generally recognized as safe (GRAS) status for human applications by the Food and Drug Administration (FDA). In addition, zein is the suitable for oral administration due to its relatively slower digestibility than other proteins. Also, zein easily forms complex with other compounds, which make it's a reliable candidate for drug delivery [10]. Zein has been used as a carrier for various bioactive and nutraceuticals compounds such as fish oil,
  tocopherol, vitamin D3, curcumin, 5-fluorouracil, tangeretin, quercetin, atorvastatin, thymol, cranberry procyanidins and daidzin [11–21].
Epigallocatechin-gallate (EGCG), a polyphenol present in green tea has gained a lot of attention due to its numerous applications such as antiviral, anti-inflammatory, antifungal and anti-obesity and also provides protection against serious fatal ailments like cancer, cardiovascular, and diabetes [22]. EGCG undergoes methylation, glucuronidation, and sulfation in gastrointestinal tract (GIT), which limits its in vivo bioavailability. Thus, a novel drug delivery system can be developed to enhance its stability and bioavailability. Nanoparticulate drug-delivery systems offers good potential have received in pharmacological field to overcome pharmacokinetic glitches such as limited bioavailability, unwanted distribution, drug resistant, and stability [23]. In the present study EGCG was conjugated/co-encapsulated with piperine—most potent bioenhancer reported till date [24]. It enhances the bioavailability of many drugs by increasing the absorption from the intestine, suppressing the drug metabolism by the body resulting in the improved anti-tumor activity of the drug [25, 26]. Piperine prevents the glucuronidation of EGCG in small intestine resulting into the increased absorption. Piperine also slows down the release of EGCG from GIT and increases the absorption rate in intestine by increasing its residence time in intestine [27]. In this work preparation of EGCG loaded nanosuspension (EGCG NS) as well as EGCG-piperine nanocomplex (EGCG-Pip NC) was accomplished using zein as a nanocarrier. Further antioxidant, haemolytic and anticancer activities of EGCG nanoformulations were also evaluated in vitro compared to pure EGCG. The optimized nanosuspensions were also assessed for in vitro drug release study simulating GIT conditions. This is the first report on encapsulation of EGCG into a zein nanocarrier alone and with a bioenhancer (piperine) till date.
2. Materials and methods
2.1. Materials
Epigallocatechin gallate, piperine (MP Biomedicals India Private Limited, Mumbai, India), zein, sulforhodamine B (SRB), RPMI 1640 and adriamycin (Sigma Chemicals Co., St. Louis, MO, USA), lecithin, tween-80, 1, 1-diphenyl- picryl-hydrazyl, vitamin C, dimethyl sulfoxide (DMSO) and acetic acid (Hi-Media Lab. Pvt. Ltd, Mumbai, India), trichloroacetic acid (SISCO Research Laboratories Pvt. Ltd, Mumbai), triton x-100 (S D fine-chem limited, Mumbai) were used in the present study. All other chemicals used were of analytical grade. Human cancer cell lines i.e. leukemia cancer (HL60), oral cancer (SCC40), breast cancer (MCF7), cervix cancer (HeLa) and colon cancer (Colo205) were procured from NCCS, Pune, India.
2.2. Preparation and optimization of EGCG NS and EGCG-Pip NC
Anti-solvent precipitation method was used for the synthesis of different types of nanoformulations which required organic phase and anti-solvent phase. The polymer (zein) and stabilizer (lecithin) were dissolved in the 70% (v/v) ethanol which forms the organic phase and the solution was filtered using  microfilter. The bioactive compounds: EGCG (25 mg) and EGCG + piperine (25 mg + 5 mg) were dissolved in the organic phase for synthesis of EGCG loaded nanosuspension and EGCG-Piperine nanocomplex respectively. The surfactant, tween-80 was dissolved in double distilled water which forms the anti-solvent phase. The addition of organic phase into the anti-solvent phase under vigorous stirring at 1200 rpm resulted into the formation of nanoparticles immediately. The similar procedure was used for the synthesis of blank nanosuspension. The prepared nanosuspensions were lyophilized in laboratory model freeze dryer (Freezone 6-Plus Labconco, USA) using 1% (w/v) mannitol as cryoprotectant.
Three-level three-factor  full factorial design expert software (version 8.0.7.1) was used for the optimization and statistical analysis which observe the effect of independent variables on dependent variables. Based on preliminary studies, the concentration of zein, tween-80 and lecithin were selected as independent variables and particle size, polydispersity index and zeta potential were taken as dependent variables. Table 1 shows the different experimental runs provided by the software.
Table 1. The effect of independent variables on various responses as particle size (PS), polydispersity index (PDI) and zeta potential (ZP).
| Runs | Concentration of zein (A) (mg/ml) | Concentration of tween-80 (B) % (W/W) | Concentration of lecithin (C) % (W/V) | PS (nm) | PDI | ZP (mV) |
|---|---|---|---|---|---|---|
| 1 | 1.00 | 0.15 | 0.75 | 103.2 | 0.352 | −29.2 |
| 2 | 5.00 | 0.05 | 1.00 | 234.7 | 0.408 | −34.8 |
| 3 | 5.00 | 0.15 | 1.00 | 226.7 | 0.418 | −27.9 |
| 4 | 3.00 | 0.25 | 1.00 | 128.8 | 0.131 | −20.8 |
| 5 | 5.00 | 0.25 | 1.00 | 218.3 | 0.315 | −22.2 |
| 6 | 3.00 | 0.25 | 0.50 | 162.2 | 0.301 | −23 |
| 7 | 3.00 | 0.25 | 0.75 | 176.5 | 0.364 | −26.2 |
| 8 | 5.00 | 0.15 | 0.50 | 184.3 | 0.476 | −30.4 |
| 9 | 1.00 | 0.25 | 0.50 | 105.9 | 0.145 | −21.6 |
| 10 | 1.00 | 0.15 | 0.50 | 94.9 | 0.176 | −20.4 |
| 11 | 5.00 | 0.25 | 0.50 | 267.7 | 0.543 | −36.3 |
| 12 | 1.00 | 0.25 | 1.00 | 95.4 | 0.161 | −22.1 |
| 13 | 5.00 | 0.05 | 0.75 | 213.8 | 0.597 | −36.4 |
| 14 | 5.00 | 0.25 | 0.75 | 256.3 | 0.676 | −33.4 |
| 15 | 5.00 | 0.15 | 0.75 | 214.3 | 0.413 | −38.1 |
| 16 | 1.00 | 0.05 | 0.75 | 111.1 | 0.182 | −38.9 |
| 17 | 3.00 | 0.15 | 0.50 | 146.7 | 0.111 | −18.8 |
| 18 | 1.00 | 0.15 | 1.00 | 106.6 | 0.482 | −32.2 |
| 19 | 3.00 | 0.05 | 0.50 | 179.1 | 0.525 | −25.5 |
| 20 | 3.00 | 0.15 | 0.75 | 121.5 | 0.175 | −19.5 |
| 21 | 1.00 | 0.05 | 1.00 | 111.5 | 0.175 | −35.2 |
| 22 | 1.00 | 0.05 | 0.50 | 98.9 | 0.128 | −20.4 |
| 23 | 1.00 | 0.25 | 0.75 | 96.5 | 0.121 | −23.8 |
| 24 | 3.00 | 0.15 | 1.00 | 126.8 | 0.386 | −24.4 |
| 25 | 3.00 | 0.05 | 1.00 | 116.7 | 0.402 | −31.3 |
| 26 | 5.00 | 0.05 | 0.50 | 203.4 | 0.531 | −35.8 |
| 27 | 3.00 | 0.05 | 0.75 | 122.8 | 0.485 | −37.3 |
| 28 |
1.00 | 0.05 | 0.75 | 118.3 | 0.125 | −36.4 |
| 29 |
1.00 | 0.05 | 0.75 | 184.2 | 0.231 | −38.3 |
aand bindicates the experimental observation of the final optimized batch for the EGCG loaded nanosuspension and EGCG-piperine nanocomplex respectively.
2.3. Characterization of the synthesized nanosuspensions
2.3.1. Particle size, polydispersity index and zeta potential analysis.
Analysis of particle size (PS), polydispersity index (PDI) and zeta potential (ZP) of the optimized nanosuspensions were evaluated to find out the  average diameter of particles, its average molecular weight and the stability of prepared nanosuspensions respectively based on dynamic light scattering (DLS) using the zetasizer nano (ZS, Malvern Instruments, Malvern) at
  .
.
2.3.2. Particle shape and surface morphological analysis.
Techniques like transmission electron microscopy (TEM), field emission scanning electron microscopy (FESEM) and atomic force microscopy (AFM) were used for studying the morphology and size of nanoformulation. For TEM imaging (TEM Morgagni 268D, Fei Electron Optics), drop of aqueous nanosuspensions was casted onto the copper grid and dried. Dried grid was loaded into the goniometer followed by image capturing. For FESEM observation, a drop of aqueous nanosuspensions was casted on a glass slide followed by stub coating of a carbon tape (Supra 55 VP model, ZIESS Instruments PVT, Ltd). Before processing, the samples were coated with gold at 20 mA followed by imaging. For AFM (AFM Tecnai  , and S-twin), a small amount of different lyophilized sample were re-dispersed into dimethylformamide and coated with a silicon wafer for imaging. Samples were imaged for AFM in a tapping mode with a scanned rate of 0.9 Hz and TEPSA tip.
2.3.3. Fourier transform infrared (FTIR) analysis.
To analyze the chemical interaction as well as confirmation of encapsulation, FTIR spectra of different samples i.e. EGCG, piperine, EGCG NS and EGCG-Pip NC were evaluated using FTIR spectrophotometer (Perkin Elmer, USA) in the frequency range of  .
.
2.3.4. Differential scanning calorimetry—thermo gravimetric analysis (DSC-TGA) analysis.
To determine the physical nature of drug and polymer, DSC-TGA thermo grams of different samples zein, EGCG, piperine, blank, EGCG NS and EGCG-Pip NC were recorded (TA Instruments DSC SDT Q600). Different samples (4–5 mg) were taken in aluminum pan and scanned in range of  with heat flow rate of
  .
.
2.4. In vitro drug release study
The release studies for EGCG, EGCG NS, EGCG-Pip NC was carried out at three pH (pH 1.2, 6.8 and 7.4) simulating GIT conditions. Nearly, 0.1 M HCl was used to make pH 1.2 whereas phosphate-buffered saline (PBS) was used to make pH 6.8 and pH 7.4. 50 mg of different nanosuspensions (weight equivalent to 5 mg of EGCG) were immersed into 100 ml of 0.1 M HCl for 2 h followed by replacing it PBS (pH 6.8 and pH 7.4), respectively. Sample (1 ml) was collected at various time intervals (0.25, 0.5, 0.75, 1, 1.5, 2, 2.5, 3, 3.5, 4, 4.5, 5, 5.5, 6, 6.5, 7, 7.5 and 8 h) and replaced with same amount of fresh buffer. Absorbance of the collected samples was examined using UV–vis spectrophotometer at 273 nm using blank nanosuspension as a reference. Each experiment was executed in triplicate.
2.5. In vitro antioxidant activity
The free-radical scavenging activity of EGCG, EGCG NS and EGCG-Pip NC was analyzed by 1,1-diphenyl-2-picrylhydrazyl (DPPH) antioxidant assay. DPPH radical scavenging, a stable free radical, is used for the assessment of the radical scavenging activity. The reaction mixture containing 1 ml of DPPH solution (3.9 mg/100 ml) was mixed with 0.1 ml of different test samples i.e. EGCG, EGCG NS, EGCG-Pip NC (25–200 µg ml−1). The mixture was sonicated for 5 min and incubating in dark for 30 min at room temperature. The absorbance of the test samples were measured using UV–vis spectrophotometer at 517 nm using methanol as a reference and vitamin C as a reference antioxidant. The % inhibition was calculated using the following formula
2.6. In vitro haemolytic assay
In vitro haemolytic assay of EGCG, EGCG NS and EGCG-Pip NC was assessed. For this, heparinized whole blood (2.5 ml) was collected from a healthy male human volunteer. The collected blood sample was centrifuged at 1000 g for 20 min at  for separation of white and red blood cells. A buffy coat formed due to white blood cells (WBCs) was removed and remaining samples were washed with PBS twice. 100 µl of red blood cells (RBCs) were added into 96 well microtiter plate containing different concentrations (2.5, 5, 10 and
  ) of nanosuspensions. Triton
  i.e. 100% hemolysis control was taken as positive control which was prepared by incubating equal amount of erythrocytes with triton
  (1%). The test samples included erythrocytes incubated with different concentrations of nanoparticles while erythrocytes incubated with PBS buffer only were taken as a negative control. The samples were incubated at
  for 60 min. To stop the reaction,
  of glutaraldehyde (2.5%) was added followed by centrifuging blood samples 1000 g at
  for 15 min. The absorbance of the supernatant was measured at 540 nm using microplate reader (SPECTROstar Nano, BMG LABTECH, Germany). The percent haemolysis was calculated as follows:
2.7. In vitro anticancer activity
EGCG, EGCG NS and EGCG-Pip NC were screened for anticancer activity on five human cancer cell lines i.e. leukemia cancer (HL60), oral cancer (SCC40), breast cancer (MCF7), cervix cancer (HeLa) and colon cancer (Colo205) using sulforhodamine B (SRB) assay. These human cancer cell lines were grown in RPMI 1640 medium containing 10% fetal bovine serum (FBS) and 2 mM L-glutamine.  of cells were seeded into 96 well micro titer plates and incubated at
  , 5%
, 5%  , 95% air and 100% relative humidity for 24 h prior to addition of experimental drugs. Stock solutions of the experimental samples were prepared in
  dimethyl sulfoxide (DMSO) and were further diluted to
  ,
,  ,
,  and
and  respectively. Upon addition of samples, plates were incubated for 48 h at standard conditions followed by addition of
  of 30% cold trichloroacetic acid (TCA) to terminate the reaction. For fixing of cells in situ, plates were incubated at
  for 60 min. The supernatant was gently removed by pipetting and plates washed with double distilled water several times and dried.
  sulforhodamine B (SRB) dye solution (0.4% in 1% acetic acid) was added to all wells and plates were incubated at ambient temperature for 20 min. To remove the unbound SRB, wells were washed repeatedly with 1% acetic acid. The plates were dried followed by eluting bound stain using subsequently 10 mM trizma base. The optical density was determined using ELISA plate reader at 540 nm. Percent growth was calculated for test wells relative to control wells. For each cell lines experiment, an anticancer drug adriamycin was used as a positive control while, DMSO served as a vehicle control. The cells treated with different concentrations of nanoparticles acted as test samples. All experiments were performed in triplicates. Parameters such as
  (concentration of the drug that produces 50% inhibition of the cells), TGI (concentration of the drug that produces total inhibition of the cells) and
  (concentration of the drug that kills 50% of the cells) were calculated.
2.8. Statistical analysis
All experiments were carried out in triplicate and mean ± SD was calculated. Optimization data were analyzed using one-way ANOVA in full factorial design expert software (version 8.0.7.1).
3. Results and discussion
3.1. Synthesis and optimization of the nanosuspensions
The EGCG loaded nanoformulation was prepared using antisolvent precipitation method. This method offers numerous advantages like simplicity, cost-effectiveness and ease of scale-up [28]. In this method, a bioactive compound dissolved into a solvent was injected into an antisolvent under vigorous stirring. The solvent used must provide clear solubility of bioactive compound as well as also miscible in nature with antisolvent. Generally, water is used as an antisolvent but organic solvents can also be employed. To produce nanoparticles with smaller particle size and narrow size distribution, it is very important to decrease mixing and increase precipitation process during antisolvent precipitation method [29]. In the present study, the organic phase contained polymer (zein), bioactive compound (EGCG in case of EGCG NS and EGCG and piperine in case of EGCG-Pip NC), a bioactive solvent (ethanol) and stabilizer (lecithin). On the other hand, the aqueous phase contained the surfactant (tween-80) which maintains nanosuspension into a homogenous and stable state. Basically, stabilizers wet the surface of drug particle completely and provide steric barriers for prevention of Ostwald's ripening and prevents agglomeration in nanosuspensions [30]. Therefore, the addition of a suitable stabilizer lowers down the excessive high surface energy generated during nanoparticles synthesis and converts coarse particles into nanometer size. The different types of nanoformulations produced by addition of organic phase to aqueous phase under constant vigorous stirring at room temperature. The final optimized concentration of zein, tween-80 and lecithin were  , 0.05 mg (% w/w) and 0.75 mg (% w/v), respectively, for synthesis of different types of nanoformulations i.e. EGCG NS as well as for EGCG-pip NC.
Nanosuspensions were optimized using design expert software (version 8.0.7.1, Stat-Ease Inc, Minneapolis, MN). A design matrix comprising of 27 runs obtained from different independent variables were screened to study their effect on different dependent variables (table 1).
The data obtained was substituted into software for statistical analysis and the polynomial equations were obtained. It was observed that response surface quadratic model after square root transformation were the best fitted model for PS whereas, response surface quadratic model with none transformation after logarithmic transformations of the data were the best fitted model obtained for PDI and ZP response respectively. The polynomial models showing the relationship between the independent variables and the dependent variables is outlined in equations (3)–(5). These equations helps us to draw conclusions after considering the magnitude of coefficient and the mathematical sign it carries i.e. positive or negative which indicates synergistic and antagonistic effects, respectively. It is evident that all the three independent variables (A, B and C) have positive effects on response PS and on response PDI whereas the ZP shows inverse relationship.
Table 2 shows the different values of mean square (MS), degree of freedom (df), Fischer ratio ( value), probability value (
 value), standard deviation (SD), coefficient of variance (CV) and value of regression coefficient
  generated from ANOVA. The
  value for all the responses are above
  (close to 1), which shows the good correlation behavior between the experimental and predicted responses and predictable and adjusted
  values were in the reasonable agreement demonstrating reliability of models. Additionally, the value greater than 4 of adequate precision is desirable and designates adequate signal. The relatively lower values of coefficient of variation indicate better precision and reliability of the experiments and
  value less than 0.5 indicates that model is significant.
Table 2. Summary of ANOVA analysis.
| Parameters | Response PS | Response PDI | Response ZP |
|---|---|---|---|
| Mean square (MS) | 12.49 | 0.077 | 109.88 |
| Degree of freedom (df) | 9 | 9 | 9 |
Fischer ratio ( value) value) |
21.28 | 10.64 | 10.57 |
Probability value ( value) value) |
<0.0001 | <0.0001 | <0.0001 |
| Standard deviation (SD) | 0.77 | 0.085 | 3.22 |
| Coefficient of variance (CV) | 6.22 | 23.73 | 11.37 |
 |
0.9185 | 0.8492 | 0.8484 |
Adjusted  |
0.8753 | 0.7694 | 0.7681 |
Predicted  |
0.8017 | 0.6187 | 0.6389 |
| Adequate precision | 13.867 | 11.343 | 10.431 |
After numerical optimization based on desirability approach the solution attained for desired responses was taken by setting constraints as, minimum PS, minimum PDI, and minimum ZP. The parameters for proposed optimal formulation were 1.00 mg of zein, 0.05 mg of tween-80 and 0.75 mg of lecithin for EGCG NS as well as for EGCG-pip NC (table 1).
3.1.1. Response surface plots.
Different 3D graphs were generated by the software for PS, PDI and ZP (figures 1–3). According to PS response surface graphs, it is concluded that zein has the more prominent effect on PS as compared to other variables (tween-80 and lecithin). As we increase the concentration of zein from 1 mg to 5 mg, the PS was increased. However, increased concentration of tween-80 and lecithin has little effect on PS (figure 1). The 3D ZP graphs show that tween-80 has more noticeable effect on ZP followed by lecithin and zein. As the concentration of tween-80 increased from 0.05% to 0.25%, the stability of nanosuspension increased. Similar results were observed in the case of lecithin i.e. only the highest concentration of lecithin affected the stability of nanosuspension (figure 2). In case of response PDI (figure 3), as the concentration of zein and lecithin increases, PDI increases while the surfactant, tween-80 maintains the mono-disperse/uniform nature of nanosuspension. PDI is a dimensionless constraint which is calculated from a simple two parameter fit to the correlation data in DLS. The lower PDI means that obtained nanosuspension consists of uniform size particles and vice versa in case of high PDI. PDI values lower than 0.7 are generally considered to be valid for DLS analysis of particle sizes [31].

Figure 1. 3D response surface graphs for particle size.
Download figure:
Standard image High-resolution image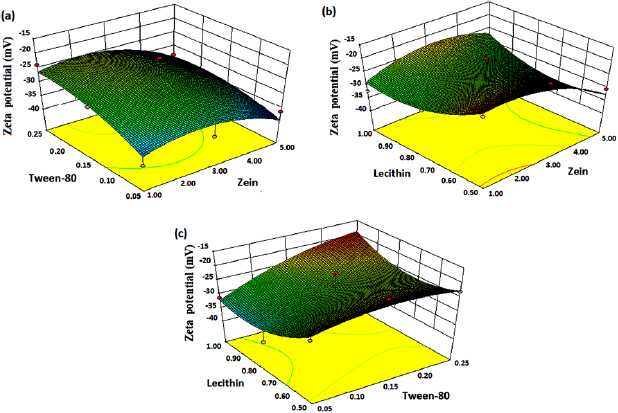
Figure 2. 3D response surface graphs for zeta potential.
Download figure:
Standard image High-resolution image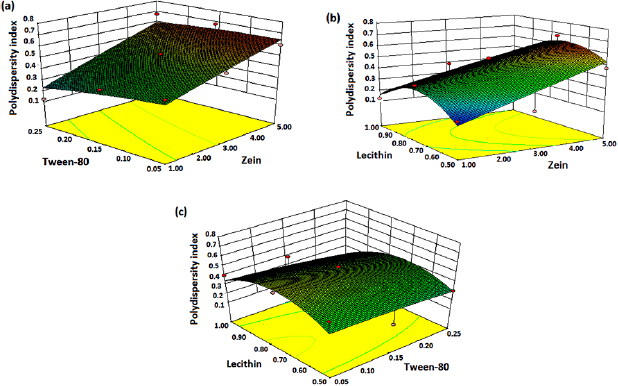
Figure 3. 3D response surface graphs for polydispersity index.
Download figure:
Standard image High-resolution image3.1.2. Perturbation plots.
The relative effect of every independent variable (zein, tween-80, and lecithin) on the each response (PS, PDI and ZP) can be seen in the perturbation plot (figures 4(a)–(c)). It was observed from figure 4(a) that PS is significantly affected by zein (A) followed by tween-80 (B) and lecithin (C). According to the PDI perturbation plot (figure 4(b)), a sharply curvature in lecithin (C) was observed and confirmed that lecithin has high influence on response ( ) followed by tween-80 (B) and zein (A). Figure 4(c) displays the perturbation graph of ZP, a very little bending was observed in tween-80 (B) and lecithin (C) confirms that the response ZP was identically sensitive to these two independent variables. The flat line of zein (A) revealed that it has less effect on response ZP [32, 33].
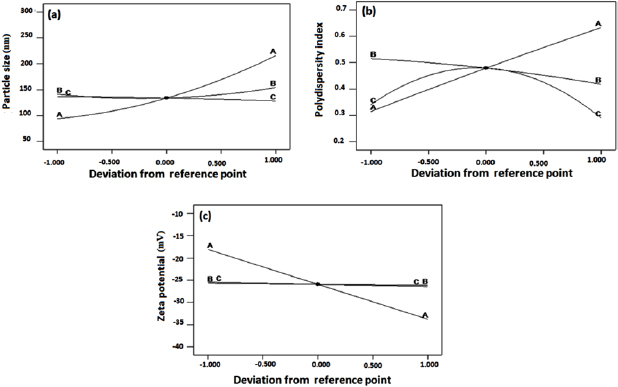
Figure 4. Perturbation plot showing the effect of different independent variables: zein (A), tween-80 (B) and lecithin (C) on responses (a) particle size, (b) polydispersity index and (c) zeta potential.
Download figure:
Standard image High-resolution image3.2. Evaluation of optimized nanosuspensions
3.2.1. Particle size, polydispersity index and zeta potential analysis.
The PS, PDI and ZP of EGCG NS and EGCG-Pip NC were found to be 118.3 nm, 0.125, −36.4 mV and 184.2 nm, 0.231, −38.3 mV, respectively (table 1). Increase in the size of EGCG-Pip NC might be due to encapsulation of two drug moiety in the polymer matrix. The low PDI value (0.125 and 0.231) of optimized nanoformulations indicates good monodispersity and uniformity of particles. Generally, ZP provides information about the stability of nanoparticles. The magnitude of ZP specifies the degree of electrostatic repulsion between particles present in nanosuspension. It was observed from the ZP values that synthesized nanoformulations was electrically stabilized for a long time.
3.2.2. Particle shape and surface morphological analysis of nanosuspensions.
The morphology of nanosuspensions was analyzed using techniques like TEM, FESEM and AFM. The TEM image of both the nanosuspensions shows that the nanoparticles were spherical in shape and in non-segregated form with size ranging from 30–90 nm. TEM images showed that EGCG NS and EGCG-pip NC were spherical in shape with a diameter range from  and
and  sizes respectively (figure 5). The difference in particle size obtained from particle size analyzer and TEM was attributed to the state of nanoparticles used and its measuring conditions. Particle size analyzer evaluates the hydrodynamic diameter of the particles present in liquid nanosuspension whereas lyophilized (dehydrated) samples were evaluated under vaccum in case of TEM [34]. Another reason behind difference in particle size measured by zetasizer and TEM is that zetasizer analyses the average particle size of the whole nanosuspension while TEM analyses the individual particle size [22].

Figure 5. TEM images of (a) EGCG NS, and (b) EGCG-Pip NC.
Download figure:
Standard image High-resolution imageFESEM images (figure 6) shows the EGCG NS, blank nanosuspension and EGCG-Pip NC respectively. In case of EGCG NS smooth and fluffy stems like structures were observed while blank nanosuspension showed stacks of rigid plates like structures having smooth edges, whereas EGCG-Pip NC forms the bundles of elongated and non-uniform fibers or rods. It can be assumed that in case of EGCG NS and EGCG-Pip NC, the soft and fluffy irregular surfaces with stratification observed may be because of absorption of drug which is lacking in blank nanosuspension [35]. The reason behind obtaining such larger nanostructures obtained in case of FESEM as compared to TEM was agglomeration and aggregation of nanosuspension. Aggregation occurs because of the high diffusion rate of solvent which may diffuse into the aqueous phase before the formation of stable nanosuspension and leading to the formation of rod and plates like structure as supported by literature [36]. Another reason behind the difference in the shape obtained from TEM and FESEM seems to be due to stabilizer used in nanoformulation. Essentially, stabilizer get absorbed on the nanoparticle surface and controls the particle size and also prevents aggregation. The FESEM images shows access adsorption of stabilizer along with conductive coating (required as sample preparation in FESEM) on the processed sample of nanoparticles that makes less resolution compared to what has been achieved using TEM essentially in the absence of above factors. It may be assumed that it is not present in enough amounts to form a monolayer over the nanoparticles at lower concentration. This lack of availability of sufficient amount of stabilizers resulted into the larger particles [37, 38]. Additionally, while performing TEM measurements, the sample amount used was very low and was probe sonicated at high frequency prior to acquiring images. This helps to remove/unsettle any kind of adsorbed stabilizer and prevent any kind of associated agglomeration of nanoparticles.
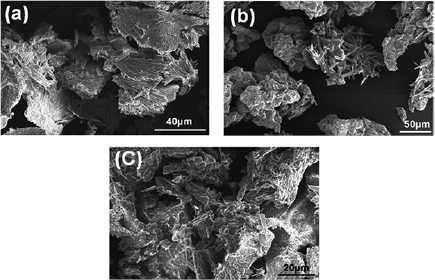
Figure 6. FESEM images of (a) EGCG NS, (b) blank NS, and (c) EGCG-Pip NC.
Download figure:
Standard image High-resolution imageThe AFM image of EGCG NS and EGCG-Pip NC revealed semi-spherical morphology with a particles size range from 41–120 nm and 55–214 nm (figures 7(a) and (b)) respectively consistent to the results obtained from zetasizer. The 3D height image (figures 7(c) and (d)) of EGCG NS (average particle height 12.61 nm) and EGCG-Pip NC (average particle height of 14.28 nm).
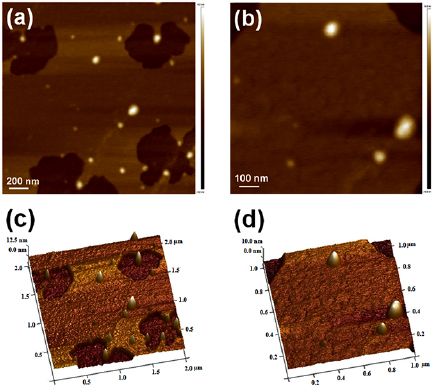
Figure 7. AFM images of (a) topography of EGCG NS, (b) topography of EGCG-Pip NC, (c) 3D height image of EGCG NS, and (d) 3D height image of EGCG-Pip NC.
Download figure:
Standard image High-resolution image3.2.3. FTIR spectral analysis.
EGCG spectrum (figure 8(a) exhibited several characteristic peaks viz.  and
and  for O-H group,
  and
and  for C=O group which connects the trihydroxybenzoate group and chroman group, peak observed at
  denotes C-H group which is present in chroman ring,
  and
and  account for O-C=O group,
  and
and  belong to O-H group,
  attributed to adjacent aromatic C-H group in the chroman ring. The spectrum shows the existence of amide bands I and II at
  and
and  , respectively [39].
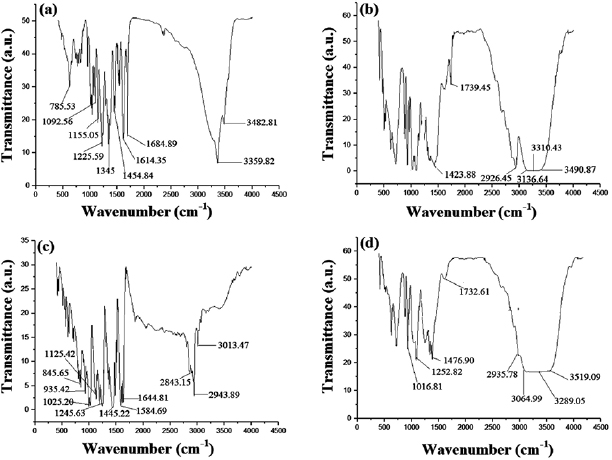
Figure 8. FTIR spectra of (a) EGCG, (b) EGCG NS, (c) piperine, and (d) EGCG-Pip NC.
Download figure:
Standard image High-resolution imageIn EGCG NS spectrum (figure 8(b)) the native peaks of EGCG at  and
and  pertaining to O-H group are merging in a broad notable band i.e.
  . The peak at
  and
and  representing the C=O group that linked the trihydroxybenzoate group and chroman group in pristine EGCG were shifted to
  and a shoulder band centered around
  ,
,  representing C-H group in the chroman ring of EGCG merged in small broad band centered at
  in EGCG NS spectrum, peak at
  and
and  for O-C=O group in native EGCG were also shifted to this small broad band i.e. at
  , peaks at
  and
and  (O-H group) in native EGCG showed blue shift in a small band centered at
  . The position of amide I band in EGCG NS spectrum has a bathochromic shift from
  to
to  .
.
FTIR spectrum of pure piperine (figure 8(c)) revealed various bands involving, aromatic C-H stretching at  and aliphatic C-H stretching at
  . Aromatic stretching of C=C at
  ,
,  involve CO-N and C=C stretching. The band appeared at
  ,
,  attributed to asymmetric and symmetric
  stretching, respectively. Peaks at
  belongs to
  bending, =C-O-C asymmetric stretching at
  and symmetric =C-O-C stretching at
  , C-O stretching occurs at
  and in plane phenyl C-H bending can be noted at
  while
while  accounts for out-of-plane C-H bending [40].
In EGCG-Pip NC spectrum the characteristic peaks involve the possible interactions among EGCG and piperine (figure 8(d)). Peaks of native piperine at  merged in small band having low transmittance and centered at
  , while
  owing to
  bending was merged in a diminished broad band at 1252.82 to
  in EGCG-Pip NC. However, the bands of piperine (=C-O-C stretching) at
  merged in small band at
  and (C-O stretching)
  to
to  in case of EGCG-Pip NC. Native EGCG peaks at
  and
and  which are responsible for O-H group are merged in a broad notable band
  centered at
  and peaks at
  and
and  were merged in small broad band
  and peak at
  was also shifted in a small band at
  respectively. The amide band I (
 ) and amide II band (
 ) of pristine EGCG were red shifted to
  and small shoulder peak at
  , respectively, which confirmed the interaction and formation of EGCG-Pip NC.
3.2.4. TGA-DSC analysis.
An overlay of TGA and DSC thermal curves conducted for zein, EGCG, EGCG NS, blank NS, piperine and EGCG-Pip NC was shown in curves (a) and curves (b) of figures 9(A)–(F), respectively.
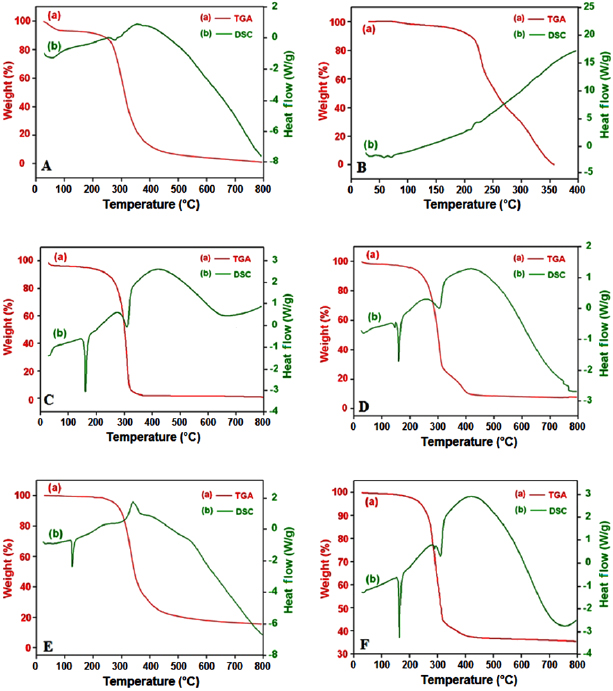
Figure 9. TGA-DSC thermograms of (A) zein, (B) EGCG, (C) blank NS, (D) EGCG NS, (E) piperine and (F) EGCG-Pip NC.
Download figure:
Standard image High-resolution imageIn case of zein (curve (a) in figure 9(A)), 7.2% of weight loss was observed in the temperature range of  that is ascribed to the vaporization of residual moisture content. Second stage of weight loss started at
  and ended at
  having 87.4% of weight loss and third decomposition occurred between
  and
and  with a weight loss of 4.68%. The total weight loss up to
  was 99.3% (curve (a) in figure 9(A)). Magoshi et al reported that zein degrades thermally at
  which is near to our TGA findings also, and resembles closely to our DSC studies of native zein as well nanosuspension [44]. In case of pure EGCG (curve (a) in figure 9(B)), the thermal transition occurred between
  , that is concomitant by 4.2% of weight loss that is believed to be due to desorption of moisture content. While calculating experimental weight loss, it was found that one molecule of water was lost during moisture removal. Second stage of weight loss began at
  and ended at
  indicating decomposition with a weight loss of 31.5%. Another significant weight loss (31.5%) was observed in third stage, ranging from
  . The weight loss continued after third stage and it was 32.0% up to
  was seen in fourth stage.
The EGCG NS (curve (a) in figure 9(C)) showed three stages of weight loss. In the first stage, ranging from  , 3.8% of weight loss was observed which corroborate the removal of moisture content. On further increase in temperature, it provoked an abrupt weight loss (94.5%) leading to the thermal degradation, which mainly occurred in the temperature range
  whereas in third stage (
 ) only 0.7% weight loss was observed. The blank nanosuspension (curve (a) in figure 9(D)) i.e. nanosuspension devoid of EGCG, showed a small weight loss of 2.9% in temperature range
  which corresponds to moisture removal. In second stage (
 ) weight loss was found to be 88.3%, while 1.5% weight loss was observed in third stage i.e. from
  . In case of piperine (curve (a) in figure 9(E)), 1.28% weight was lost in first stage of weight loss involving temperature range
  , whereas in second stage (
 ) significant weight loss (78.7%) was observed. In third stage 4.2% weight loss was observed up to
  . The TGA curve of EGCG-Pip NC (curve (a) in figure 9(F)) enclosing zein, EGCG as well as piperine revealed three stages of weight loss. The onset of weight loss started from
  and ended at
  , pertaining to a very small weight loss (0.7%), which was due to moisture removal. In second stage from 138.6 °C to
  the significant weight loss was observed which was found to be 62.2%, whereas 1.8% weight loss was observed in third stage.
The DSC thermogram of pure zein exhibited two endothermic peaks of very low intensity confirming its amorphous nature (curve (b) in figure 9(A)). The first at  pertaining to the mobilization of zein molecules due to heat resulting in transition from the amorphous to rubbery state and second at
  refers to the melting point of zein and it is very near to melting point study carried out on melting point apparatus [41]. In case of EGCG thermogram (curve (b) in figure 9(B)), small endothermic peak was observed at
  followed by a small transition at
  that corresponds to its melting point and decomposition respectively and confirming its amorphous nature as well [39]. The EGCG NS showing peak at
  shows the melting of the nanosuspension followed by its degradation, the onset of which started at
  (curve (b) in figure 9(C)). In blank nanosuspension, an endothermic peak at
  corresponds to melting point of nanosuspension; simultaneously the exothermic event started at
  corresponds to its degradation of blank nanosuspension (curve (b) in figure 9(D)). DSC profile of piperine reflects a sharp endothermic peak at
  , which reveals its melting point as well as crystalline behavior [42]. An exothermic peak was also observed at
  that may be due to the decomposition of piperine as shown in curve (b) of figure 9(E). DSC thermogram of EGCG-Pip NC (curve (b) in figure 9(F)) displayed endothermic peak at
  , which reveals the melting of the nanocomplex followed by its degradation at
  . There is one common peak (
 ) observed in blank, EGCG NS and EGCG-Pip NC that corresponds to mannitol, a cryoprotectant used in the study denoting its crystalline nature [43].
In the present study thermo gravimetric analysis (curves (a) in figures 9(A)–(F)) was performed to study moisture content and weight loss as functions of temperature. The stages of weight loss including temperature ranges, percentage weight loss, and melting point are listed in table 3.
Table 3. Weight loss profile of zein, pure EGCG, EGCG NS, blank NS, piperine and EGCG-Pip NC.
| Sample | Weight loss stages | Temperature range  |
Weight loss (%) | Total weight loss (%) | Melting point  |
|---|---|---|---|---|---|
| Zein | first | 27.81–101.45 | 7.2 | 99.27 | 280.33 |
| second | 101.45–496.95 | 87.39 | |||
| third | 496.95–800 | 4.8 | |||
| EGCG | first | 76.22–176.26 | 4.19 | 99.2 | 218.5 |
| second | 176.26–235.60 | 31.5 | |||
| third | 235.60–290.76 | 31.5 | |||
| fourth | 290.76–350 | 32.01 | |||
| EGCG NS | first | 29.59–121.30 | 3.78 | 98.95 | 311.80 |
| second | 121.30–371.23 | 94.47 | |||
| third | 371.23–800 | 0.65 | |||
| Blank NS | first | 30.04–121.30 | 2.83 | 92.57 | 307.76 |
| second | 121.30–422.97 | 88.27 | |||
| third | 422.97–800 | 1.47 | |||
| Piperine | first | 28.42–109.27 | 1.28 | 84.11 | 131.79 |
| second | 109.27–537.38 | 78.66 | |||
| third | 537.38–794.08 | 4.17 | |||
| EGCG-Pip NC | first | 29.59–138.57 | 0.73 | 64.74 | 312.05 |
| second | 138.57–452.59 | 62.2 | |||
| third | 452.59–800 | 1.81 | |||
After analyzing all the results, it was assumed that in case of all nanosuspension i.e. blank nanosuspension, EGCG NS and EGCG-Pip NC, there was considerably reduced moisture desorption content in first stage of weight loss (figure 9 and table 3) as compared to the native zein sample, which may be due to the mannitol. This significant change might be due to the increased hydrogen bonding between mannitol and protein which causes decrease in moisture absorption or adsorption. The percentage of moisture content should be less for a protein (zein) for its stability, otherwise oxidation and deamidation take place [45]. The percentage of residual moisture content in blank nanosuspension, EGCG NS and EGCG-Pip NC was found to be 2.8, 3.9 and 0.7, respectively, which is relatively low as compared to native zein and EGCG, which was found to be 7.2 and 4.2 respectively.
3.3. In vitro drug release study
The in vitro drug release was carried out at  for three different pH of 1.2, 6.8 and 7.4 simulating GIT conditions. The solution with pH 1.2 signifies the gastric condition of stomach whereas solutions with pH 6.8 and pH 7.4 denote the jejunal region of small intestine and pH of the ileum segment, respectively. Desired samples were placed in pH 1.2 (for 1 h) followed by replacing it with pH 6.8 (for 2 h) and finally in pH 7.4 (for 5 h). At pH 1.2, EGCG NS and EGCG-Pip NC revealed 7% and 11% cumulative release, respectively, while pure EGCG showed cumulative release of 17.35%. As the pH increased, cumulative release (%) was also increased. Two releases of 34% and 22% were detected in jejunal part of small intestine (pH 6.8) in case of EGCG NS and EGCG-Pip NC, respectively, whereas 55.08% was observed in EGCG. At pH 7.4, maximum drug release was showed by EGCG NS and EGCG-Pip NC which was 58% and 49%, respectively. However, 39.5% and 81.2% was observed at pH 6.8 and pH 7.4 for EGCG alone (figure 10). A controlled drug release behavior was shown by EGCG NS and EGCG-Pip NC. The initial rapid release at pH 1.2 was mainly ascribed to weakly bound or adsorbed drug near the surface of the synthesized nanoparticles. From the previous studies, it was reported that zein can be used as a nanocarrier for the delivery of numerous bioactive compounds. The main reason behind this is the slow digestible nature of zein which makes it stable against enzymatic degradation [46]. So, synthesized nanosuspensions could be efficiently protected from the gastric and intestinal enzymes digestion in gastrointestinal tract. Another reason is the isoelectric point of zein. There was a lesser release rate was observed at pH 6.8 as compared to pH 7.4. That may be assumed because of the isoelectric point (pI) of zein which affects the zein solubility. Zein has slightest solubility at pH 6.8 media resulting into the lower release rate at pH 6.8 than pH 7.4 [15].
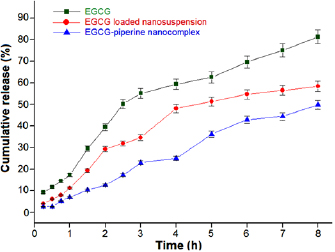
Figure 10. In vitro drug release study of EGCG, EGCG NS and EGCG-Pip NC simulating gastro-intestinal tract conditions.
Download figure:
Standard image High-resolution imageThe variation in drug release pattern depends on nature of the drug used and its stability. The faster release which was observed in case of pure drug as compared to its nanoformulations might be due to the hydrophilic nature of EGCG which makes it an easily diffusible into release media. On the other hand, encapsulation of EGCG into zein nanocarrier lowers down its release in media by making a sheath around the drug [47]. Another reason behind difference in release rate of EGCG is attributed to its stability. EGCG is more stable at pH 1.2 and its stability decreases as the alkalinity of the media increases. Thus, in case of pure drug more release was observed at pH 7.4 as compared to pH 1.2 and pH 6.8 because free EGCG undergo oxidation in media. It was also reported from the earlier studies that encapsulation of EGCG into polymers protect it from oxidation which increased its stability and ultimately resulting into controlled drug release behavior [48].
3.4. In vitro antioxidant activity
Free radical scavenging activity of EGCG, EGCG NS and EGCG-Pip NC was evaluated by DPPH antioxidant assay. Vitamin C was used as a reference antioxidant. DPPH is very well known free radical substrate which is used for assessment of antioxidant activity. The addition of molecule with radical scavenging potential to DPPH solution leads to change its color from deep violet to pale yellow and decrease in optical density at 517 nm was also observed. The reason behind antioxidants to act as a radical scavenging agent was attributed due to their hydrogen donating capacity. It was perceived that EGCG, EGCG NS, EGCG-Pip NC and vitamin C displayed dose dependent behavior i.e. as the concentration increased from  to
to  , the inhibition rate was also increases (figure 11). That's also confirmed from the previous studies [49]. EGCG NS and EGCG-Pip NC hold significantly higher radical scavenging activity than pure EGCG. The later one showed maximum inhibition over to pure EGCG and EGCG NS. That may be assumed that piperine potentiates the activity of EGCG and both EGCG and piperine displayed synergistic antioxidant effect [50].
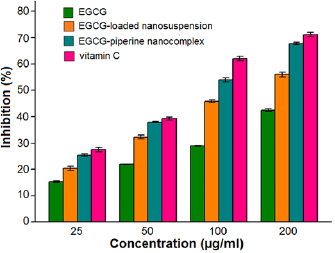
Figure 11. In vitro antioxidant activity of EGCG, EGCG NS, EGCG-Pip NC and vitamin C using DPPH assay.
Download figure:
Standard image High-resolution image3.5. In vitro haemolytic activity
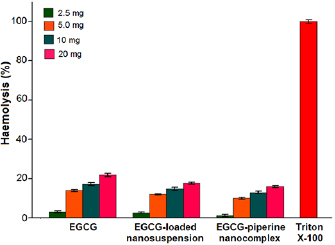
Haemolytic assay was performed to evaluate the toxicity of EGCG, EGCG NS and EGCG-Pip NC with four different concentrations. A good nanoformulation should be non-haemolytic in nature i.e. does not cause harm to the RBCs. More the percent haemolysis, more it cause rupturing of red hemoglobin. Percent haemolysis is more observed in case of EGCG as compared to EGCG NS and EGCG-Pip NC (figure 12). The higher % hemolysis observed in case of EGCG NS than EGCG-Pip NC might be due to diffusion of drug from nanoparticles during incubation. On the other hand, EGCG-Pip NC displayed lower hemolysis rate which might be attributed to strong electrostatic interactions between the drugs and polymer as well as also because of its controlled drug release behaviour. The order of percent haemolytic activity of different samples is shown as follows:

Figure 12. In vitro haemolytic activity of EGCG, EGCG NS, EGCG-Pip NC in comparison with  at different concentrations.
Download figure:
Standard image High-resolution image
Nanoparticles coated with protein (zein) were less susceptible to haemolysis over non-coated ones and zein can be used as nanocarrier in the field of drug delivery because of negligible effect on haemolysis [51]. 100% haemolysis was observed in case of positive control (triton  ). From figure 12 it is observed that haemolysis increased as the concentration increased and it shows a concentration- dependent behavior. This can be confirmed from the prior studies as well. The concentration-dependent haemolysis difference at low and high dose assumed to be because of dual functional nature of EGCG i.e. at low dose; EGCG acts as antioxidant whereas it acts as pro-oxidant at higher doses. EGCG has been reported to provide protection against oxidant stress induced due to free radicals on membrane of erythrocytes [52, 53]. But, higher consumption of EGCG results into generation of oxidative stress [54–56].
3.6. In vitro anticancer activity
EGCG, EGCG NS and EGCG-Pip NC encapsulated in protein nanocarrier were screened for anticancer activity against HL60, SCC40, MCF7, HeLa and Colo205 cell lines using SRB assay and the results are depicted in table 4. EGCG-Pip NC displayed comparable anticancer activity similar to adriamycin against HL60 and SCC40 cell lines which might be due to the synergistic effect shown by the bioenhancer. The EGCG NS and EGCG-Pip NC exhibited enhanced anticancer activity than the pure EGCG.
Table 4. In vitro anticancer activity of EGCG, EGCG NS, EGCG-Pip NC and adriamycin using SRB assay.
| Samples | Control growth (%) | ||||||
|---|---|---|---|---|---|---|---|
10  |
20  |
40  |
80  |
  |
TGI  |
  |
|
| HL60 cell line | |||||||
| EGCG | 93.4 ± 3.5 | 82.1 ± 3.2 | 74.2 ± 5.8 | 62.9 ± 2.9 | >80 | >80 | >80 |
| EGCG NS | 80.6 ± 6.7 | 72.6 ± 4.6 | 63.2 ± 2.7 | 58.3 ± 3.1 | >80 | >80 | 51.5 |
| EGCG-Pip NC | 72.8 ± 2.4 | 47.6 ± 3.3 | 38.3 ± 2.5 | 24.9 ± 3.2 | >80 | >80 | 38.1 |
| Adriamycin | 89.6 ± 3.9 | 51.3 ± 3.3 | 41.9 ± 2.8 | 29.8 ± 2.5 | >80 | >80 | <10 |
| SCC40 cell line | |||||||
| EGCG | 82.3 ± 6.9 | 75.1 ± 13.4 | 69.7 ± 10.9 | 61.7 ± 21.4 | 69.2 | 28.4 | >80 |
| EGCG NS | 56.3 ± 5.4 | 47.7 ± 3.3 | 43.8 ± 7.4 | 41.6 ± 5.6 | 64.7 | 26.3 | <10 |
| EGCG-Pip NC | 50.4 ± 2.1 | 45.7 ± 10.4 | 44.6 ± 0.7 | 40.4 ± 2.4 | 58.3 | 20.7 | <10 |
| Adriamycin | 45.5 ± 4.4 | 46.6 ± 8.6 | 30.3 ± 4.9 | 29.9 ± 8.8 | 47.5 | <10 | <10 |
| MCF7 cell line | |||||||
| EGCG | 100.6 ± 3.5 | 100.1 ± 5.7 | 99.1 ± 6.6 | 98.4 ± 4.2 | >80 | >80 | >80 |
| EGCG NS | 100.1 ± 5.3 | 100.2 ± 2.5 | 86.3 ± 4.0 | 74.3 ± 3.2 | >80 | >80 | 54.6 |
| EGCG-Pip NC | 90.6 ± 0.8 | 49.6 ± 9.3 | 36.7 ± 3.5 | 24.7 ± 4.2 | >80 | 77.9 | 27.1 |
| Adriamycin | −38.8 ± 1.7 | −46.5 ± 12.4 | −50.1 ± 15.5 | −50.5 ± 1.3 | 61.2 | <10 | <10 |
| HeLa cell line | |||||||
| EGCG | 100.9 ± 1.9 | 100.5 ± 5.3 | 100.2 ± 6.2 | 91.8 ± 2.4 | >80 | >80 | >80 |
| EGCG NS | 100.7 ± 5.3 | 100.2 ± 7.6 | 84.8 ± 2.8 | 71.2 ± 3.6 | >80 | >80 | 77.2 |
| EGCG-Pip NC | 100.4 ± 4.2 | 100.1 ± 5.7 | 71.2 ± 3.8 | 42.6 ± 3.7 | >80 | >80 | 63 |
| Adriamycin | −57.6 ± 1.9 | −59.9 ± 3.5 | −60.6 ± 2.9 | −66.6 ± 1.7 | 47.5 | <10 | <10 |
| Colo 205 cell line | |||||||
| EGCG | 97.7 ± 6.0 | 92.3 ± 2.9 | 83.6 ± 8.2 | 72.1 ± 1.2 | >80 | >80 | 68.4 |
| EGCG NS | 90.5 ± 6.5 | 85.1 ± 7.0 | 73.8 ± 6.6 | 48.5 ± 8.3 | >80 | 72.1 | 52.7 |
| EGCG-Pip NC | 84.6 ± 8.9 | 80.9 ± 8.7 | 56.2 ± 8.7 | 37.6 ± 7.6 | >80 | 67.9 | 28.1 |
| Adriamycin | −4.7 ± 2.2 | −27.4 ± 3.5 | −33.2 ± 4.2 | −44.7 ± 8.9 | >80 | 29.7 | <10 |
The decrease of control growth (%) was observed with increase in concentration of tested compounds. EGCG, EGCG NS, EGCG-Pip NC and adriamycin showed dose—dependent behaviour on cell growth with a concentration range  against all the five cell lines. Adriamycin, a positive control displayed linear cytotoxic response against all cell lines with respect to drug concentration. A study of
  value of cell lines indicated that EGCG NS and EGCG-Pip NC were most effective against SCC40 cell line. EGCG-Pip NC were least effective against cell lines (MCF7, Colo205 and HL60) and no activity was detected against Hela cell line. Although, EGCG NS and EGCG-Pip NC encapsulated in protein nanocarrier showed enhanced anticancer activity against HL60, SCC40, MCF7, HeLa and Colo205 than pure EGCG. EGCG- Pip NC displayed better anticancer activity than EGCG NS which may be attributed to the synergistic effect shown by both drugs. As it was reported in literature, the property like higher cellular uptake efficiency makes nano drug delivery system more effective than the free drug [57, 58]. Even though, free drugs possess the potential to diffuse into the cell nucleus directly, but enhanced effect displayed by drug encapsulated into nanoparticles in the present study was attributed to sustain drug release behavior [58].
4. Conclusion
Epigallocatechin gallate loaded nanosuspension (EGCG NS) and epigallocatechin gallate -piperine nanocomplex (EGCG-Pip NC) using protein nanocarrier were prepared by anti-solvent precipitation method and optimized using full factorial design expert software. Zein, a corn protein was employed as a nanocarrier due to its non-toxicity, biocompatibility and generally recognized as safe (GRAS) status by the Food and Drug Administration for human applications. Synthesized nanosuspensions show an optimal size and a stable zeta potential. The optimized nanosuspensions revealed a sustained drug release pattern and improved in vitro antioxidant activity as compared to pure compound. The haemolytic study indicated that that synthesized nanosuspensions is safe for human use up to a certain concentration. A significant increase in vitro anticancer activity of EGCG was observed after nanoencapsulation. The boosted antioxidant profile and low hemolytic activity of nanoformulation make them an ideal candidate for drug delivery applications and holds a lot of potential for pre-clinical and clinical research in near future.
Acknowledgments
The authors thank DST-Nano mission for providing infrastructural facility for execution of the study. The first author, SD (IF 130021) thanks Department of Science and Technology for providing INSPIRE Fellowship. The authors express gratitude to SAIF, AIIMS, New Delhi and the Department of Applied Physics, Guru Jambheshwar University of Science and Technology, Hisar for morphological and texture analysis respectively. The authors also thank ACTREC, Kharghar, Navi Mumbai for evaluation of in vitro anticancer activity.