

Abstract
Production of yarn made of high purity carbon nanotubes (CNTs) is essential to novel macro-scale applications in the making of bulletproof vests, electrically conductive wire, antennas and mechanical actuators. In this study, which serves as a preliminary investigation towards optimization and scaling-up of production of high purity yarn using direct spinning of CNT bundles in a swirled floating catalyst chemical vapour deposition (SFCCVD), yarn was produced through direct spinning of CNT bundles. CNT bundles were synthesized in the SFCCVD reactor using acetylene as the carbon source and ferrocene as the catalyst. Effect of feed flow rate and reaction temperature on the production was investigated. Morphology, degree of defect and electrical conductivity of the as-produced yarn were checked using scanning electron microscopy (SEM) and transmission electron microscopy (TEM), Raman spectroscopy and four-probe method, respectively. CNT yarn was successfully obtained at a reactor temperature of  and at acetylene flow rate of 135 ml min−1. SEM micrographs of the fibrous structure show high degree of alignment parallel to the fibre direction with good consistency. Results from the four-probe method test show a typical linear ohmic behaviour indicating that the samples are electrically conductive. Higher reactor temperature favours the production of CNT yarn with a higher electrical conductivity and less crystalline defects.
Export citation and abstract BibTeX RIS

Original content from this work may be used under the terms of the Creative Commons Attribution 3.0 licence. Any further distribution of this work must maintain attribution to the author(s) and the title of the work, journal citation and DOI.
1. Introduction
CNTs have been the focus of many studies due to the unique electrical and mechanical properties possessed by individual CNTs, which surpass the properties of many advanced materials available for industrial applications. CNTs are seamless cylinders consisting of one or more layers of graphene, ideally orientated such that all carbon atoms are bonded in a hexagonal lattice except at their ends [1]. Other attractive attributes of CNTs include: a low density, a large aspect ratio, resistance to degradation under ambient conditions due to its thermal stability; chemical inertness identical to that of graphite; and preservation of mechanical properties at elevated temperatures [2]. These attributes make CNTs a promising alternative to copper, silicon and aluminium in electrical devices [3]. Furthermore, these properties make CNTs suitable for novel applications in energy storage, nano-mechanics, bio-technology [4], reinforcement of materials and catalyst support in fuel cells [5].
Exploitation of the remarkable properties of CNTs in many applications requires that CNTs exist on a macroscopic scale such as in the form of fibres or yarns, wherein CNTs are aligned parallel to each other and to the fibre axis [6]. The lightweight yarn-like structure of CNT fibres is characterised by exceptional toughness, resilience to bending stresses, a high surface area and good integration into polymers or complex fabrics towards the production of high-performance fibres [7, 8]. These characteristics make CNT yarns suitable for weaving into macroscopic objects, such as bulletproof vests, electrically conductive wire, antennas and materials that block electromagnetic waves [9, 10]. They may further be applied as mechanical actuators for artificial muscles, sensors, flexible batteries and solar cells [11, 12].
Different methods such as forest spinning, liquid-crystalline spinning, surfactant-based coagulation spinning and direct spinning have been used to produce CNT yarns. Forest spinning involves drawing and twisting synthesised CNTs on a substrate. Liquid-crystalline spinning is a wet-spinning process from a liquid-crystalline suspension of CNTs. Surfactant-based coagulation spinning includes injecting a polymeric binder between CNTs to produce CNT yarns. Direct spinning method produces CNT yarns simultaneously with CNT synthesis. Direct spinning has the greatest potential for the industrial-scale production of CNT yarns in comparison to the other three CNT yarn synthesis methods [13, 14].
In the work of Zhong et al [15] and Koziol and Paukner [16], CNT yarn was produced via the dry spinning method in a horizontal chemical vapour deposition (CVD) gas flow reactor with on-site water vapour densification. Ethanol was utilised as the carbon source, with ferrocene as the catalyst and thiophene as the promoter. SEM analysis of the produced yarns revealed the presence of iron catalyst on the yarn surface. TEM analysis showed that the yarn consisted of double-walled CNT (DWCNT) bundles of 30–50 nm in thickness, where each DWCNT had a diameter of 6 nm. Using the two-probe method, the electrical conductivity of the yarn was quantified at 180 S m−1. Liu et al [17] produced CNT fibres obtained using a floating catalyst in a CVD process where ethanol, hexane and methane were employed as carbon sources. The obtained CNT fibres were of a high purity with minimal crystalline defects as indicated by a defect-to-graphene (D/G) ratio of 0.03. Jiang et al [9] developed a continuous CNT yarn spinning method that entailed twisting yarn freshly spun from a super-aligned CNT array, followed by passing the twisted yarn through different solvents (such as water, ethanol and acetone) to facilitate shrinking of the produced yarns. The electrical properties of the produced CNT yarns were compared to that of a thin metal wire such as gold wire. The comparison shows that the CNT yarns displayed very low electrical conductivity when compared to that of a metal wire, but they were far lighter than metal wire making them better as ultra-thin conductive wires.
In spite of the studies reported in literature, production of defect-free yarn from CNTs depends on the operating conditions, types of reactor and catalyst used. Therefore, in this study, yarn was produced in a SFCCVD via direct spinning method. Effect of reactor temperature and feed flow rate on the yield quality and electrical conductivity of the obtained yarn was also studied. During the synthesis in the SCFCCVD, acetylene was used as the carbon source, ferrocene as the catalyst and argon as the carrier gas. Physicochemical properties and electrical conductivity of the produced yarns were compared with literature for logical conclusions.
2. Experimental
2.1. Materials
The SFCCVD reactor employed in this study was designed and fabricated as described in Iyuke [18]. It comprised of a 70 mm by 820 mm vertical quartz plug flow reactor in a furnace. The reactor is equipped with PT-100 thermocouples to indicate the temperature and a temperature controller to regulate the temperature. In addition, the system is equipped with a set of four rotameters and a flow controller to measure and control the flow of gases into the reactor. A 5-coil turn swirled mixer was fixed to the bottom end of the reactor to enhance the mixing of ferrocene aerosol, carbon precursor and carrier gas before entering into the reaction zone. An electric motor with spinning rate of 1400 rpm was attached to the top of the reactor to spin the produced CNT into yarns (see figure 1 for schematic illustration of the reactor).

Figure 1. A schematic illustration of the swirled floating catalytic chemical vapour deposition (SFCCVD) reactor set up.
Download figure:
Standard image High-resolution imageNitrogen gas (99.999%), argon gas (99.999%) and acetylene gas ( ) were purchased from Afrox (South Africa). Ferrocene (98%), used as the catalyst, was obtained from Sigma Aldrich (South Africa). All the materials were used as supplied without any further purification.
2.2. Production of CNT yarn
Before the production of yarn using the SFCCVD, the system was purged with nitrogen gas to remove any contaminants and also to check for gas leaks. The SFCCVD reactor was then heated up to a desired temperature while argon was passed through the system to create inert environment for the reaction. The swirled mixer was heated to a temperature of  with the aid of a heating tape to prevent crystallization of ferrocene as it travels through the region. When the desired reactor temperature was reached, ferrocene was introduced into the vaporizer and heated until evaporation. Then, acetylene and argon were fed into the unit as the ferrocene evaporates and the electric motor at the reactor exit was switched on. The ferrocene evaporation was monitored through the glass window on the vaporizer. The reaction was stopped when all the ferrocene has evaporated from the vaporizer and then the reactor was allowed to cool down. Thereafter, the spun yarn was collected from the surface of the motor shaft. Experimental conditions under which the yarns were produced are shown in table 1.
Table 1. Experimental conditions for the production of the CNT yarn.
| Sample | Reactor temperature  |
Acetylene flow rate (ml min−1) | Notation (Y-T-F) |
|---|---|---|---|
| 1 | 900 | 100 | Y-900-100 |
| 2 | 900 | 135 | Y-900-135 |
| 3 | 1000 | 100 | Y-1000-100 |
| 4 | 1000 | 135 | Y-1000-135 |
Y-T-F: Y = yarn, T = temperature, F = flow rate.
2.3. Characterization of as produced CNT yarn
SEM micrographs of the CNT yarns were obtained using an FEI Quanta 200 ESEM operated at 30 kV to check the morphology. A spatula tip of each sample was mounted onto an aluminum stub using carbon tapes. Two layers of gold-palladium coating, each of 10 nm in thickness, were applied to the mounted samples before taking images of the samples using the microscope.
FEI Tecnai T12 TEM operated at 120 kV was used to obtain 2D images of the CNT fibres. To prepare the samples for TEM analysis, a spatula tip of each of the samples was ultrasonically dissolved in 5 ml of methanol until they were well dispersed and formed a suspension in the solvent. A drop of this suspension was spread onto a copper grid and the copper grid was mounted onto the sample holder and loaded onto the instrument.
Raman spectra were obtained using a Horiba LabRAM HR Raman spectrometer equipped with an Olympus BX41 microscope. A Lexel argon ion laser at a wavelength of 514.5 nm (green line) was used to excite Raman scattering in the samples. A 100 × objective was used to collect the backscattered light, which was dispersed via a 600 lines mm−1 grating onto a liquid nitrogen cooled charge coupled device (CCD) detector. The laser power at the samples was ~0.4 mW to prevent localized heating.
2.4. Electrical conductivity measurement of the yarn
Four-probe method tests of the CNT yarn samples were conducted using a High Field Cryogen Free Measurement System (Cryogenic Ltd). Double-sided tape was used to mount a small quantity of each of the samples onto the sample holder. The mounted sample was pressed into a  mat. Silver conductive paint was applied to the four corners of the mat to provide contact between the mat and the sample holder. The paint was allowed to dry before the sample holder was mounted on a resistivity probe and connected to a four terminal configuration. Measurements were taken at room temperature by passing a voltage of 0–2 V through each sample. The electrical conductivity of each sample was calculated as described elsewhere [19] and presented below.
The gradient of the linear I-V curve obtained for each sample was used to estimate the resistance of each sample in accordance with Ohm's law, using equation (1):
The resistivity of each sample was calculated using equation (2):
The electrical conductivity of each sample was calculated using equation (3):
Where  is the resistance of the sample,
  is the cross-sectional area of the mat (equivalent to
  ),
),  is the length of the mat (equivalent to 5 mm),
  is the resistivity of the sample and
  is the electrical conductivity of the sample.
3. Results and discussion
3.1. Physio-chemical characterization
3.1.1. Morphology.
From the SEM micrographs shown in figure 2, it could be observed that there is presence of impurities in all the samples. These impurities are also evident in the TEM micrographs depicted in figure 3, where the nanomaterial is obscured with agglomeration of black particles. The agglomeration of black particles present could be attributed to the iron particle residues from the catalyst and perhaps, presence of amorphous carbon due to incomplete nucleation of carbon precursor [4]. This observation was confirmed by the elemental composition obtained from energy-dispersive x-ray spectroscopy (EDS) on sample Y-900-100, which showed the presence of copper and iron impurities in the sample (see figure 4). Other impurities obtained could be attributed to the presence of impurities in the ferrocene catalyst used in the synthesis.

Figure 2. SEM micrographs of as-produced samples (a) Y-900-100 (b) Y-900-135 (c) Y-1000-100 (d) Y-1000-135.
Download figure:
Standard image High-resolution image
Figure 3. TEM micrographs of as-produced samples (a) Y-900-100 (b) Y-900-135 (c) Y-1000-100 (d) Y-1000-135.
Download figure:
Standard image High-resolution image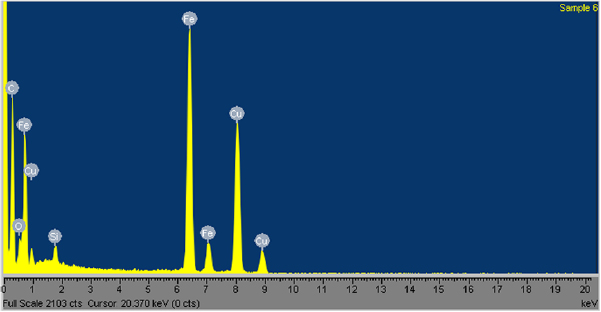
Figure 4. EDS spectrum of sample Y-900-100 showing its elemental composition.
Download figure:
Standard image High-resolution imageThe TEM images depicted in figure 3 reveal hollow tubular structure with inner diameter and length of several nanometers, thus confirming the presence of CNTs [6]. As shown in figure 3(a), the sample contained metal-filled CNTs with traces of iron impurities trapped within the hollow core of the CNTs. This could be attributed to the presence of excess iron catalyst particles which could not form nucleation sites for CNT growth [20]. Furthermore, figure 3(d) shows a knot-like structure which could be attributed to the spun of CNT bundles to form a twisted yarn structure [21].
Upon the analysis of the SEM images depicted in figure 2, formation of fibrous structures was observed in sample Y-900-135 (figure 2(b)) and sample Y-1000-135 (figure 2(d)). However, due to the large amount of catalyst residues present in sample Y-900-135, figure 2(b) does not provide a reliable indication that the structure resembles CNT yarn. Instead, an instrument with a higher resolution, such as the FEI Nova Nanolab 600 FEG-SEM/FIB, was required to assess the degree of alignment of CNTs within the structure before it can be deduced that the fibrous structure in sample Y-900-135 was indeed CNT yarn.
The SEM micrograph of sample Y-1000-135 (figure 2(d)) displays a fibrous structure that is continuous and resembles that of a yarn, such as cotton or wool. Additional SEM micrographs of the fibrous structure are presented in figure 5. Images shown in figure 5 provide evidence of a high degree of alignment parallel to the fibre direction and throughout the fibre thickness. Since CNTs are present in sample Y-1000-135 and the sample comprised mainly of carbon and iron as aforementioned, it can be deduced that the external morphology of the fibrous structure is a result of CNTs aligning into a fibre, thus indicating that CNT yarn was successfully spun.
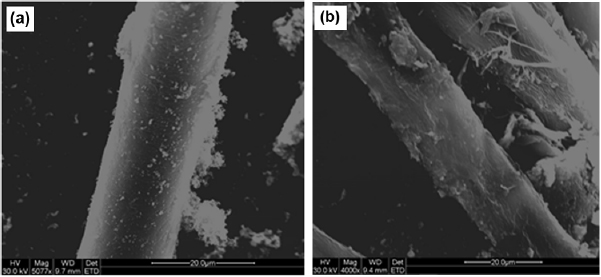
Figure 5. SEM micrographs of the fibrous structure observed in sample Y-1000-135, (a) exhibiting good consistency; (b) exhibiting a high degree of alignment.
Download figure:
Standard image High-resolution image3.1.2. Raman spectroscopy of the as produced yarn.
The graphitization of the as-produced yarn samples was checked using Raman spectroscopy. A Raman spectrum of each sample is shown in figure 6. For each sample, Raman scattering was excited at three randomly selected spots in order to provide a better representation of the overall surface of the samples.
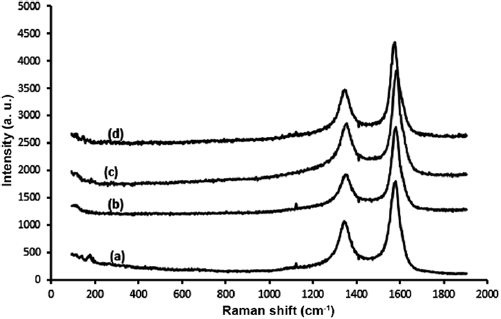
Figure 6. Raman spectra of the as-produced yarn (a) sample Y-900-135 (b) sample Y-1000-135 (c) sample Y-1000-100 (d) sample Y-900-100.
Download figure:
Standard image High-resolution imageIn a typical Raman spectrum of CNTs, two characteristic peaks are observable: the D-band which is located between  and
and  and the G-band which is located between
  and
and  [22, 23]. The D-band is assigned to disordered carbon or defects generated by the deformation of the original sp2-based structure. The G-band is representative of the degree of graphitization associated with the nanotube growth or corresponds to the stretching mode in the graphene plane [24]. As depicted in figure 6, the D-band and G-band are clearly identifiable within the aforementioned ranges in the Raman spectra of all the samples. This confirms that CNTs were produced and present in each sample. The noise observed in the spectra could be attributed to the iron impurities present in the samples [25].
The intensity ratio (D/G ratio) is an index of the degree of surface structural deformation, where a greater ratio signifies that greater disorder is present [26]. The obtained intensity ratio of each sample is listed in table 2. As shown in table 2, sample Y-900-100 is associated with the highest intensity ratio, indicating that it is more disordered than the other samples. However, sample Y-1000-135 possessed the lowest intensity ratio, indicating that it exhibits the highest degree of graphitization. The greater amount of disorder in sample Y-900-100 could be attributed to the presence of both carbon nanospheres and nanotubes in the sample, while sample Y-1000-135 exhibits more order as the CNTs have been aligned into fibrous structures.
Table 2. Intensity ratios of the as-produced CNT yarns.
| Sample no | Sample | D/G ratio |
|---|---|---|
| 1 | Y-900-100 | 0.6657 |
| 2 | Y-900-135 | 0.5202 |
| 3 | Y-1000-100 | 0.5197 |
| 4 | Y-1000-135 | 0.5096 |
For the same acetylene flow of 135 ml min−1, it was observed that the higher reaction temperature produced a sample with less disorder (sample Y-1000-135). This result supports the findings of Iyuke and Simate [27], who reported that the crystallinity of synthesized CNTs is dependent on the pyrolysis temperature such that a higher temperature gives a better crystal structure.
3.2. Electrical conductivity of the yarn
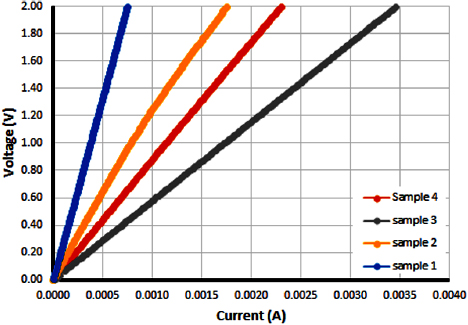
From the four-probe method tests, typical linear ohmic behaviour was observed for all the as-synthesized samples, indicating that the samples were metallic in nature and electrically conductive. The ohmic behaviour, which describes the curfrent–voltage (I-V) characteristics of the samples, is depicted in figure 7. The average electrical conductivity of each sample is shown in table 3.
Table 3. Electrical conductivity of as-produced samples.
| Sample no | Sample | Electrical conductivity (S m−1) |
|---|---|---|
| 1 | Y-900-100 | 0.08 |
| 2 | Y-900-135 | 0.17 |
| 3 | Y-1000-100 | 0.35 |
| 4 | Y-1000-135 | 0.31 |
Figure 7. Relationship between applied voltage and current for the produced CNT yarns.
Download figure:
Standard image High-resolution image
The electrical conductivity of all samples is lower than that of typical CNT fibre reported in literature and lower than that of the conducting wires such as copper [28]. This could be attributed to the high impurity content of the yarn and structural flaws such as misalignment, local entanglements, poor densification or the presence of amorphous carbon [28]. At the same acetylene flow rate (135 ml min−1) but different temperatures ( and
and  ), sample Y-1000-135 exhibited a higher conductivity than sample Y-900-135, indicating that a higher reaction temperature results in a more conductive fibre, which has also been observed in literature. Niven et al [29] reported an increase in the electrical conductivity of yarn at increasing annealing temperature because resistance decreases with temperature. This is also in accordance with the results from the Raman spectroscopy and the SEM; where we observed that sample Y-1000-135 had a lower degree of disorder which is favourable to a more conductive fibre.
However, sample Y-1000-100 displayed a better conductivity than sample Y-1000-135, whereas sample Y-1000-135 has a lower degree of disorder according to Raman spectra. This inconsistency could be attributed to the difference in their chirality vectors. The electronic structure of CNTs does not depend on degree of disorder only, but also on the chirality vector of the CNTs [30]. Furthermore, Miao [21] reported the effect of yarn porosity on its conductivity measurement. Since the conductivity of the yarn was determined based on the cross-sectional area of the sample mat, there is possibility of fewer CNTs in a unit area and fewer CNT-to-CNT contact points in the mat cross-section could also affect the conductivity measurement.
4. Conclusion
This study, although preliminary in nature, has demonstrated that CNT yarn was successfully obtained from CNT bundles produced from a SFCCVD reactor via direct spinning method. High quality yarn was obtained at a reactor temperature of  and a feed flow rate of 135 ml min−1. Images and spectra obtained from TEM and Raman spectroscopy, respectively, confirm the presence of CNTs in all the samples and indicate the presence of catalyst residues (iron). SEM micrographs of the fibrous structure obtained at reactor temperature of
  and at an acetylene flow rate of 135 ml min−1 reveal high degree of alignment parallel to the fibre direction with good consistency. The CNT yarn produced under these conditions show less defects, and a higher electrical conductivity than the material produced at 135 ml min−1 flow rate and at a lower temperature of
  . Therefore, it can be concluded that a higher reaction temperature yields fibre associated with more order and a lower resistance (i.e higher conductivity). Though the study reported in this article is preliminary in nature, but the results could serve as the basis for the development of further R&D in the field towards optimizing and up-scaling the production of yarn from SFCCVD reactor via direct spinning method. Concerted research efforts are ongoing in our laboratory on the optimization and scale-up studies. Outcome of these investigations will be communicated in the future.
Acknowledgments
The authors acknowledge the National Research Foundation (NRF) for financial assistance through grant No: NRF-CPRR106053, the technical staff of WITS MMU for their assistance with the SEM & TEM characterization, and the technical staff of the School of Chemical and Metallurgical Engineering for their assistance with the fabrication of the SFCCVD reactor.