


Abstract
Electrospun nano-polycaprolactone (PCL) is an ideal candidate for biomedical applications, as it mimics the extracellular matrix and possesses good biocompatibility, biodegradability and mechanical properties. Formic acid/acetic acid (FA/AA) and formic acid/acetone (FA/A) solvent systems were reported to be the safest solvents for the preparation of nanoscale electrospun polycaprolactone and they are also a common solvent with many natural polymers. In the present study a comparison between the electrospun fibers produced by the two systems was done. The optimum conditions for preparing PCL nanofibers were studied. The results indicated that finer fibers were found for formic acid/acetic acid in comparison with those produced by formic acid/acetone solvent system. In addition, it was found that optimum conditions for PCL nanofibers electrospinning were detected for 70:30 FA/AA solvent ratio with 15% PCL concentration and a tip to collector distance of 12.5 cm at 20 kV.
Export citation and abstract BibTeX RIS

Original content from this work may be used under the terms of the Creative Commons Attribution 3.0 licence. Any further distribution of this work must maintain attribution to the author(s) and the title of the work, journal citation and DOI.
1. Introduction
Electrospun membranes constitute a broad range of materials with a number of applications from biomedical to environmental fields [1]. Membranes from nanofibrous materials mimic the extracellular matrix as they are characterized by a high surface area to volume ratio and the presence of multiporous structure [2]. Electrospinning has attracted tremendous attention as it provides a simple and versatile method for fabricating nanofibers from a rich variety of polymers or polymers loaded with non-spinnable materials, so allowing a wide variety in design in of functional membranes [3, 4]. A typical electrospinning setup contains a high voltage DC (or AC) supply (usually in the range of 10–50 kV), a spinneret with a metallic needle, and a collector [5]. High voltage is applied between the metallic needle and the collector. As a result, a drop of the polymer solution from the spinneret will be electrified to form a Taylor cone. By increasing the electric force, the Taylor cone will overcome the surface tension and then undergo a continuous elongation forming the electrospun fibers on the collector [5].
Recently, nanofibrous mats of polycaprolactone have been of a great interest in scientific literature focusing on scaffolds for tissue engineering [6–8]. Polycaprolactone (PCL), a semi-crystalline linear synthetic hydrophobic polymer, is one of the most commonly used polymers in electrospinning either alone or in combination with other additives to fabricate nano-fibrous mats for many biomedical applications [9]. For medical applications, it is somehow essential to have a fiber diameter in the nano-range in order to mimic the extracellular matrix (ECM) morphology to optimize cell growth [10]. PCL was often produced by chloroform but it produces rather microfibers instead of nano-fibers as the diameters were in the range from 3 to 5 µm [11]. PCL nanofibers were also produced by other relatively highly toxic solvents and relatively costlier solvents, such as dimethylformamide (DMF), tetrafluoroethylene, methylene chloride, dichloroethane and pyridine but some of them lacks stability and reproducibility [12]. Nano-PCL fibers were produced successfully by safer solvent mixtures as formic acid/acetone (FA/A) and formic acid/acetic acid (FA/AA) systems [12, 13]. Both solvent systems were reported as the safest solvent systems [12, 13] and also they are a common solvent of polycaprolactone with other polymers such as chitosan, gelatin and collagen [14–17]. During the research work, a comparison between the fibers produced by the two systems was done. In addition, the optimum conditions for PCL electrospinning in the system with the best attained results were investigated.
2. Materials and methods
2.1. Materials
Polycaprolactone (PCL, 99%, Mn 70 000–90 000, Sigma-Aldrich), formic acid (85%, Edwic, Egypt), acetone (99%, Edwic, Egypt) and acetic acid (96%, Edwic, Egypt) were used as purchased without any purification.
2.2. Electrospinning parameters study
2.2.1. Solvent study
Polycaprolactone (PCL) solutions were prepared by dissolving a calculated amount of PCL in a 70:30 FA/A solvent system. In parallel, the same quantity of PCL was dissolved in a FA/AA one. Both solutions were left under magnetic stirring up to 3 h for complete dissolution.
2.2.2. Solvent ratio study
The best solvent system was selected for further studies. To study the optimum solvent ratio, all the other electrospinning parameters such as voltage and distance, were fixed. Different solvent ratios were prepared as follows: formic acid (100%); 90:10, 70:30, 50:50, 30:70 and 10:90 FA/AA solvent ratios as well as acetic acid (100%).
2.2.3. Different PCL concentrations study
In order to study the optimum PCL concentration, all the other electrospinning parameters such as applied voltage and tip to collector distance were kept fixed. The concentration of PCL was set at 12.5, 15.0, 17.5 and 20.0%.
2.2.4. Applied voltage study
To study the optimum applied voltage, all the other electrospinning parameters such as concentration and tip to collector distance were kept fixed. The voltage was set at three different values (15.0, 17.5 and 20.0 kV).
2.2.5. Tip to collector distance study
To study the optimum tip to collector distance, all the other electrospinning parameters such as concentration and applied voltage were kept fixed. The distance was set at three different values (10.0, 12.5 and 15.0 cm).
2.3. Characterizations
2.3.1. Fiber morphology
Fiber morphology was studied under field emission scanning electron microscope (FESEM), Jeol JXA 840. The diameter of the electrospun fibers was determined by measuring about 80–100 individual fibers with the image analysis software (image J 1.42q software (NIH, Betheseda, Maryland, USA).
2.3.2. Rheological measurements
Viscosity measurement was examined at 22 °C as a function of time on the polymer solution system using Brookfield viscometer (model DV-III Ultra). The polymeric solution was put in the built-in stainless steel container attached with a temperature controller. Measurements were done using S21 spindle at 50 RPM under uniform temperature.
The change of viscosity by time (ηc) was calculated by using the following equation:
where η is the viscosity after the determined time and η0 is the initial viscosity of the solution.
2.3.3. Conductivity measurements
The change in conductivity by varying the solvent ratios and polymer concentrations was done at 25 °C using conductivity meter (HC3010, Trans-instruments).
3. Results and discussion
3.1. Solvent study
3.1.1. Fiber morphology
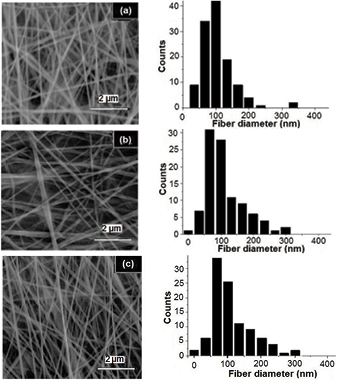
The scanning electron microscopy images of the produced fibers from formic acid/acetic acid (FA/AA) and formic acid/acetone (FA/A) solvent systems were shown in figure 1. From the figure, it was shown that the fibers produced from FA/AA solvent system mostly occur in a range less than 100 nm which is much finer than that produced by FA/A solvent. This might be attributed the additional acidic hydrolytic effect of acetic acid. Therefore, FA/AA solvent system was selected for further studies.

Figure 1. SEM images of the electrospun PCL fibers produced for: (a) FA/AA, and (b) FA/A solvent systems as well as their distribution charts, respectively.
Download figure:
Standard image High-resolution image3.1.2. Rheological measurements
The viscosity values of the two polymeric solvent systems were illustrated in table 1. The change in the values of the viscosity with time for both solvent systems was shown in figure 2. It is found that FA/AA solvent system showed less stability than FA/A solvent system, as acetic acid was involved in the acidic hydrolysis of PCL which may fasten its hydrolytic degradation.
Table 1. The mean fiber diameter, viscosity and conductivity values of FA/AA and FA/A solvent systems.
| Parameters | Solvent systems | |
|---|---|---|
| FA/AA | FA/A | |
| Mean fiber diameter (nm) | 112.66 ± 55.10 | 191.34 ± 91.10 |
| Viscosity (cP) | 248 ± 2.35 | 245 ± 2.54 |
| Conductivity (µS) | 425 ± 1.23 | 417 ± 2.28 |
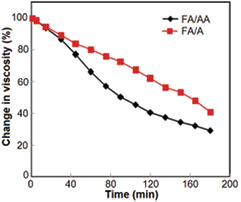
Figure 2. The change in viscosity with time for FA/AA and FA/A solvent systems.
Download figure:
Standard image High-resolution image3.1.3. Conductivity measurements
The conductivity values of the two solvent systems are clarified in table 1. Both solvent systems showed nearly equal conductivity values. It is noticed that FA/AA solvent system revealed a slightly higher conductivity value.
3.2. Solvent ratio study
3.2.1. Fiber morphology
The scanning electron microscopy images of the produced fibers for 70:30, 50:50, 30:70 and 10:90 FA/AA solvent ratios, as well as acetic acid, were shown in figure 3. Formic acid and 90:10 FA/AA samples were not viscous enough as presented in table 2 and hence they were unstable to produce fibers. The polymeric solutions were thus electrosprayed rather than been electrospinned in both solvent systems. A high ratio of formic acid causes a major influence on the electric field applied during electrospinning causing solvent molecules reorientation. This leads to instability in electrospinning and therefore adding acetic acid will help to overcome this instability. These results were in agreement with the study of Van der Schueren [12]. However, by increasing the acetic acid ratio to more than 50%, a decrease in the electrospinning reproducibility was observed. The mean fiber diameter showed an increasing trend by increasing acetic acid ratio as observed in table 2 and figure 3. This may be attributed to the increase of viscosity and decrease in conductivity [18].

Figure 3. SEM images of the electrospun PCL fibers produced for (a) 70:30, (b) 50:50, (c) 30:70 and (d) 10:90 FA/AA solvent ratios and (e) acetic acid as well as their distribution charts, respectively.
Download figure:
Standard image High-resolution imageTable 2. The mean fiber diameter, viscosity and conductivity values of formic acid; 90:10, 70:30, 50:50, 30:70 and 10:90 FA/AA solvent ratios as well as acetic acid.
| Parameters | Formic acid | FA/AA solvent ratios | Acetic acid | ||||
|---|---|---|---|---|---|---|---|
| 90:10 | 70:30 | 50:50 | 30:70 | 10:90 | |||
| Mean fiber diameter (nm) | — | 120.8 ± 33.60 | 145.7 ± 39.54 | 176.9 ± 52.24 | 200.5 ± 66.22 | 282.0 ± 141.53 | |
| Viscosity (cP) | 9 ± 1.64 | 124 ± 2.87 | 253 ± 4.49 | 570 ± 3.38 | 984 ± 3.25 | 1047 ± 5.34 | 1590 ± 5.98 |
| Conductivity (µS) | 1704 ± 9.82 | 887 ± 7.28 | 429 ± 6.97 | 161.10 ± 3.56 | 49.80 ± 0.96 | 12.14 ± 0.12 | 5.21 ± 0.054 |
3.2.2. Rheological measurements
The viscosity measurements of the different solvent ratios were represented in table 2. The change in viscosity with time for both solvent systems was shown in figure 4. It was found that by increasing the acetic acid ratio up to 90%, the polymeric solution became more stable by time. This might be attributed to formic acid high polarity (dielectric constant of 57.2εo at 25 °C) in comparison to acetic acid polarity (dielectric constant of 6.6εo at 25 °C) [18]. These results were in agreement with the results of De Vrieze and his coworkers [19] on their study of the instabilities of polyamide in pure formic acid. On the other hand, the pure acetic acid solution had a very low conductivity which leads to a highly viscous and stable solution, but it showed a difficulty in electrospinning. By combining FA and AA in adequate ratios, a solvent system with optimum stability and viscosity was attained.
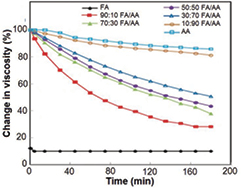
Figure 4. Change in viscosity with time for: formic acid, 90:10, 70:30, 50:50, 30:70 and 10:90 FA/AA solvent ratios as well as acetic acid.
Download figure:
Standard image High-resolution image3.2.3. Conductivity measurements
As illustrated in table 2, by increasing the presence of acetic acid the conductivity decreases which increased the electrospinning difficulty. This was attributed to the low conductivity of acetic acid compared to formic acid as stated above. Intermediate polarity is attained by combining acetic acid and formic acid of suitable ratio to get optimum electrospinning conditions.
3.3. Different PCL concentrations study
3.3.1. Fiber morphology
The scanning electron microscopy images of the produced fibers from 12.5, 15.0, 17.5 and 20.0% PCL were represented in figure 5. The fibers produced from 12.5% PCL (image (a)) showed some beads and some droplets. This may be due to electrospraying occurrence at low concentration instead of electrospinning due to the low viscosity and the high surface tension of the solution [20]. At suitable concentration, smooth nano-fibers can be obtained [21]. Higher concentrations (17.5 and 20.0% PCL) caused the production of helix-shaped micro-ribbons [22]. Moreover, faster solidification of the jet occurred at higher polymer concentration due to the presence of higher amounts of entanglements which have increased the difficulty of leaving the needle thereby causing thicker fibers.
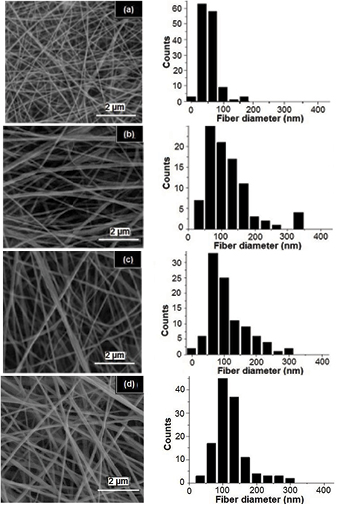
Figure 5. SEM images of the electrospun PCL fibers produced for (a) 12.5%, (b) 15.0%, (c) 17.5% and (d) 20.0% PCL concentrations as well as their distribution charts, respectively.
Download figure:
Standard image High-resolution image3.3.2. Rheological measurements
The viscosity values of the different PCL concentrations were represented in table 3. As noticed from the table, as the concentration increases the mean fiber diameter increases due to the rise in viscosity as the amount of PCL increases. The viscosity and also the stability were increased as the added amount of PCL increases as shown in figure 6. This may be attributed to the increase in PCL amount which takes more time to be degraded. The least required PCL concentration to get nanofibers was found to be 15.0%.
Table 3. The values of mean fiber diameters, viscosity and conductivity of PCL concentrations.
| Parameters | PCL concentration (%) | |||
|---|---|---|---|---|
| 12.5 | 15.0 | 17.5 | 20.0 | |
| Mean fiber diameter (nm) | 72.51 ± 22.52 | 127.18 ± 56.73 | 133.42 ± 63.56 | 140.15 ± 45.99 |
| Viscosity (cP) | 246 ± 1.36 | 308 ± 2.32 | 391 ± 2.99 | 420 ± 3.67 |
| Conductivity (µs) | 483 ± 3.82 | 425 ± 3.23 | 404 ± 2.89 | 381 ± 2.57 |

Figure 6. Change in viscosity with time for: 12.5, 15.0, 17.5 and 20% PCL concentrations.
Download figure:
Standard image High-resolution image3.3.3. Conductivity measurements
As presented in table 3, by increasing the concentration of PCL, the conductivity value decreases, which may be attributed to the decrease in the free solvent ions causing a slight reduction in the total conductivity.
3.4. Fiber morphology of applying voltage study
The scanning electron microscopy images of the produced fibers by using the applied voltage of 15.0, 17.5 and 20.0 kV were represented in figure 7. At 15.0 kV, the mean fiber diameter was found to be 127.9 nm ± 55.83 nm and the reproducibility of the fibers was the lowest. By increasing the applied voltage, usually fiber diameter reduction occurs due to the increased stretching of the electrospinning jet; however increasing voltage was reported also to have the reverse effect [22, 23]. At 17.5 kV, the fibers seemed to be tangled and with a higher reproducibility even though with a higher fiber diameter (146.6 nm ± 55.72 nm). The mean fiber diameter for 20.0 kV was found to be 123.3 nm ± 36.73 nm. As observed, there was no specific trend as reported by Yördem and his coworkers [24] and also by Li and Wang [22]. However, by increasing the applied voltage the reproducibility increases.

Figure 7. SEM images of the electrospun PCL fibers produced from (a) 15.0 kV, (b) 17.5 kV and (c) 20.0 kV applied voltages as well as their distribution charts, respectively.
Download figure:
Standard image High-resolution image3.5. Fiber morphology of tip to collector distance study
The scanning electron microscopy images of the produced fibers at tip to collector distances 10.0, 12.5, 15.0 cm were presented in figure 8. The mean fiber diameters for 10.0, 12.5 and 15.0 cm were found to be 127.37 ± 46.95, 120.18 ± 56.73 and 102.27 ± 48.55 nm, respectively. Tip to collector distance plays a direct role on jet flight time and electric field strength. At 10.0 cm, the flight time was shortened and also the solvent evaporation time, and the electric field strength was increased, which results in the increase of bead formation [25]. At 12.5 cm, more time was provided for the fluid jet to stretch fully and for the solvent to evaporate completely. At 15.0 cm, the gap was increased so the collected fibers were partially dried before reaching the collector and fully stretched, and therefore fiber diameter was reduced; however the fibers reproducibility decreased. The optimum tip to collector distance was found to be 12.5 cm.
Figure 8. SEM images of the electrospun PCL fibers produced from (a) 10.0 cm, (b) 12.5 cm and (c) 15.0 cm tip to collector distances as well as their distribution charts, respectively.
Download figure:
Standard image High-resolution image
4. Conclusion
In the present study, a comparison between the electrospun fibers produced by formic acid/acetic acid (FA/AA) and formic acid/acetone (FA/A) solvent systems was studied. It was found that FA/AA produced much finer fibers than that produced by FA/A solvent system. FA/AA solvent system was chosen for optimum conditions study. The optimum solvent ratio, concentration, tip to collector distance and voltage were also investigated. It was found that the optimum conditions for PCL nanofibers electrospinning were for 70:30 FA/AA solvent ratio with 15.0% PCL concentration at 20.0 kV and a tip to collector distance of 12.5 cm. Nano-PCL will be further used in biomedical applications.
Acknowledgments
The authors gratefully acknowledge the financial support from the National Research Center of Egypt (NRC) and also the financial support from the Academy of Scientific Research and Technology (ASRT).