

Abstract
The bioactivity of the PLA/d-HAp nanocomposite with 30 wt.% d-HAp was evaluated by in vitro tests and indicated that after 7 immersion days in SBF solution, PLA amorphous part was hydrolyzed and PLA crystal part was remained. The formation of apatite on the surface of the material was observed. The in vivo test results of PLA/d-HAp nanocomposite (70/30 wt/wt) on femur of dogs displayed that 3 months after grafting, the materials did not induce any osteitis, osteomyelitis or structural abnormalities. The histological and x-ray image demonstrated a growth of the bone into the material area, while osteitis and osteomyelitis were not observed.
Export citation and abstract BibTeX RIS

Original content from this work may be used under the terms of the Creative Commons Attribution 3.0 licence. Any further distribution of this work must maintain attribution to the author(s) and the title of the work, journal citation and DOI.
1. Introduction
Over the past decade, hydroxyapatite (Ca10(PO4)6(OH)2, HAp) has been widely used as bioceramic for bone tissue engineering due to osteoconductivity, biocompatibility, excellent bioactivity, chemical and structural similarity to the mineral phase of native bone [1–4]. However, its clinical applications have been limited because of brittleness, difficulty of shaping; extremely slow degradation in vivo [5]. Recently, the fabrication of nanocomposites based on HAp and biodegradation polymers is attracting the attention of scientists because of their ability in replacing the metal and alloy implants [6]. Poly(lactic acid) (PLA) has been chosen for tissue engineering scaffold due to their good biodegradability and biocompatibility [7–9]. The final degradation products of PLA are H2O and CO2, which are neither toxic nor carcinogenic to the human body and eliminated by natural way. Further PLA has high elastic modulus which is higher than that of natural cancellous bone [10]. In the nanocomposite, PLA plays a role to improve mechanical property and HAp contributes by resembling the natural microstructure analogous to those of bone.
PLA/HAp nanocomposites were fabricated by many methods such as: emulsion method, melt mixing, high pressure processing, electrospinning and solvent casting method [11–13]. In these methods, solvent casting method was used commonly because it does not require expensive equipment, can create a big amount of products.
In vitro bioactivity of PLA/HAp nanocomposites can be evaluated by immersing the material in saline [14], phosphate buffered saline (PBS) [15] and the simulated body fluids (SBF) [3, 16–18]. Validity of the material can be best observed under in vivo conditions after its implantation in an organism. These results showned that after 12 weeks implanted in femur bone of a Wistar rat, the hydrolysis of PLA and the formation of new bone were observed. Simultaneously, the collagen fibers were formed at sites where PLA was hydrolyzed. Thus PLA/HAp nanocomposites behaved as the natural bone which are phagocytosed and resorbable, they can be considered as biocompatible [7, 9].
In this work we used nanocomposite containing PLA, magnesium and zinc-doped hydroxyapatite (d-HAp), poly(ethylene oxide) (PEO) and xenetic with the ratio 70/30/5/10 (wt/wt/wt/wt) to investigate the formation of apatite on the surface of material immersed in the SBF solution and their weight changes were also discussed. The in vivo research was carried out on femur of dogs. The body temperature, femoral radiographs before and after implantation were investigated.
2. Experimental
In previous research we investigated and chose a suitable condition to synthesize PLA/d-HAp nanocomposite by solvent casting method [19]. PLA/d-HAp nanocomposite (70/30 wt/wt) has E modulus of about 550 MPa and the tensile strength of 18 MPa.
The material was fabricated for testing in vitro in the SBF solution and in vivo on femur of dogs. In order to observe the materials during the implantation on femur of dogs, the material must have a photoresist capacity. Hence, the photoresist (xenetic 10 wt.%) was added into the nanocomposite. The gel paste mixture containing PLA, d-HAp, PEO and xenetic (70/30/5/10 wt/wt/wt/wt) into dichloromethane (DCM) was pelleted (10 × 15 × 0.2 mm3) (PLA/d-HAp). The pellets were sterilized before testing in vitro and in vivo.
2.1. In vitro test
The in vitro degradation property of PLA as well as the formation of apatite on the surface of PLA and PLA/d-HAp nanocomposites were evaluated in the SBF solution. 1 l of SBF solution was prepared according to typical procedure [3, 20–22] by using the following materials: 8 g NaCl; 0.35 g NaHCO3; 0.4 g KCl; 0.48 g Na2HPO4 · 2H2O; 0.1 g MgCl2 · 6H2O; 0.18 g CaCl2 · 2H2O; 0.06 g KH2PO4; 0.1 g MgSO4 · 7H2O and 1 g glucoza were dissolved in distilled water. The pH of the SBF solution is 7.4 (this value is in the pH range of the human body fluids pH = 7.35–7.45) [23]. The samples of PLA or PLA/d-HAp nanocomposites were immersed in the cell containing 40 ml SBF, and kept at 37 °C, during different immersion times: 1, 3, 7, 14, 21 and 28 d. Then they were gently rinsed with distilled water before being dried with 24 h at room temperature. pH of SBF solution, weight loss and SEM images of the samples were determined.
The mass of PLA and PLA/d-HAp nanocomposites before and after immersed in SBF solution was determined by Precisa XR 205 SM-DR analysis balance. The pH value of SBF solution was measured by using pH3110 Meter.
The surface of PLA/d-HAp nanocomposites before and after immersion in the SBF solution were examined by using Hitachi S-4800 scanning electron microscope (SEM).
The phase component of PLA and PLA/d-HAp before and after 7 immersion days in SBF solution were analyzed by x-ray diffraction (XRD) (Siemens D5000 Diffractometer, Cu-Kα radiation (λ = 1.540 56 Å) with step angle of 0.030°, scanning rate of 0.042 85° s−1, and 2θ degree in range of 10–60°.
2.2. In vivo test
2.2.1. Body and local temperature measurement.
Rectal temperature sensor (MLT1403, AD Instrument,) was put on the dog's anus for body temperature recording and surface temperature sensor (MLT422/D, AD Instrument) was put onto the surgical site for dog's thigh temperature recording.
The sensors were connected to the signal amplifiers (Bio Amps) and signals were collected by using the Powerlab (data acquisition system) and Labchart software (AD Instrument, Australia).
Data was analyzed by using Labchart software, temperature results were average of about 3 min data recording.
2.2.2. X-ray image recording method.
Animals were anesthetized by using ketamine (5 mg kg−1), and lying on the table. The left leg was lifted up, pulled to opposite side to avoid overlapping image.
Animal femur x-ray images were taken by using following parameters: shooting dose of 60 kV, current density J = 35 mA s and distance D = 1 m, film size: 24 × 30 cm2, placed just behind the femur.
2.2.3. Electrocardiogram (ECG) recording method.
Animals were anesthetized by using ketamine (dose of 5 mg kg−1, intramuscular injection). Dog was supine on the operating table, shaving and clean in four dog's soles.
Surface ECG electrodes were attached to dog's leg follow recording rule. The electrodes were connected to the signal amplifiers (Bio Amps) and signals were collected by using the Powerlab (data acquisition system) and Labchart software (AD Instrument, Australia).
ECG data were analyzed by using module ECG analysis in Labchart software.
2.2.4. Hematological and biochemical indices analysis method.
Hematological indices were analyzed by using Swelab Alpha Hematology analyzers, airline Swelab, Sweden in 2014.
Biochemical blood parameters: were analyzed by using biochemical automatic machine BTS 350 (Biosystem, Spain, 2014).
3. Results and discussion
3.1. In vitro test of PLA/d-HAp nanocomposites
The in vitro degradation of PLA as well as the formation of apatite on PLA and PLA/d-HAp nanocomposite (70/30 wt/wt) into the SBF solution was evaluated by the variation of the pH (figure 1). The obtained results showed that the pH of two solutions decreased according to immersion time. The pH value of the solution containing PLA decreased more than that of the nanocomposite. It can be explained as follows. When these materials were immersed into the SBF solution, two processes occurring simultaneously: the first process expressed by following equations

is hydrolysis of PLA to generate lactic acid, and release H+ ion, the second process

is the formation of HAp, which consumes OH− ion. Both of processes reduced pH of the SBF solution.

Figure 1. The pH variation of SBF solution according to immersion time of PLA and PLA/d-HAp nanocomposite (70/30 wt/wt).
Download figure:
Standard image High-resolution imageThe pH value of the SBF solution containing PLA was slower than that containing PLA/d-HAp nanocomposite because of the presence of PEO as a compatibiliser which made the interaction between PLA and d-HAp better and the hydrolysis of PLA in PLA/d-HAp nanocomposite became more difficult than neat PLA sample. Besides, d-HAp in the component of the nanocomposite was crystal nucleation to promote process of formation of apatite crystals on the surface of material. The formation of new apatite crystal also hinders interface of PLA with the SBF solution, leading to the slow hydrolysis of PLA in the nanocomposite. Furthermore, the decrease of the pH solution can be explained due to the formation of apatite on the surface of the nanocomposite: the hydrolysis of PLA released H+ ion, leading to the dissolution of d-HAp in the following equation

The concentration of ions forming HAp (Ca2+,  , OH−) increased in the surrounding SBF, which promoted the formation of apatite crystal.
The variation of weight of PLA and PLA/d-HAp nanocomposite during immersion time was displayed in figure 2. The weight of PLA decreased correspondingly to the negative mass change. This result showed that the hydrolysis of PLA was more dominant than the formation of apatite. For the PLA/d-HAp (70/30 wt/wt) sample, the hydrolysis process of PLA in 3 immersion days happened strongly, leading to decrease in the weight of the sample. However, after 7 and 10 immersion days, the weight of the sample was higher than that of 3 immersion days, it showed that during this time, the formation of apatite was stronger than the hydrolysis of PLA. The weight of this sample after 14 immersion days was approximately with that of the sample before immersing (Δm = −2 × 10⁻⁵ g). The variation of this sample weight after 21 immersion days had positive value which indicated that the formation of apatite was more dominant than the hydrolysis of PLA. This can be explained by the formation of apatite crystals on the surface of PLA/d-HAp which hinders the interface of PLA with the SBF solution.

Figure 2. The variation of weight of PLA and PLA/d-HAp nanocomposite according to immersion time in SBF solution.
Download figure:
Standard image High-resolution imageFigures 3 and 4 displayed SEM images of PLA and PLA/d-HAp nanocomposite (70/30 wt/wt) which were immersed in the SBF solution with different immersion times. It is clear that apatite was formed on the sample surface. With the neat PLA sample after 7 d immersed in the SBF solution, the new apatite crystals were observed on the surface of the sample and formed thick block after 21 immersion days. However, SEM images still showed sites where PLA was not covered by apatite crystals (figures 3(b) and (c)).

Figure 3. SEM images of PLA sample (a) before and after (b) 7 immersion days, (c) 21 immersion days in SBF solution.
Download figure:
Standard image High-resolution image
Figure 4. SEM images of PLA/d-HAp (a) before and after (b) 7, (c) 14 and (d) 21 immersion days in SBF solution.
Download figure:
Standard image High-resolution imageThe SEM image of PLA/d-HAp nanocomposite (70/30 wt/wt) before soaking in the SBF solution indicated that d-HAp crystal in the nanocomposite was cylinder shape. After soaking in SBF solution, the formation of the new apatite crystals on the sample surface was flakes-like shape and the surface of PLA/d-HAp nanocomposite was nearly full covered by the apatite crystals after 7 immersion days. Specially, after 14 and 21 immersion days in SBF solution, the apatite crystals were full covered and uniform arrangement on the surface of PLA/d-HAp nanocomposite. This result also proved good compatibility of PLA and HAp in PLA/HAp/PEO nanocomposite prepared by solvent casting method.
Figure 5 presented the XRD pattern of PLA and PLA/d-HAp nanocomposite before and after 7 immersion days in the SBF solution. The XRD pattern of PLA (curve 1 in figure 5) showed that PLA is a semicrystalline polymer. After 7 immersion days in SBF solution, PLA amorphous part was hydrolyzed and remained PLA crystal part with two characteristic peaks at 2θ = 16.92° and 2θ = 19.50° (curve 2 in figure 5) [12]. The XRD pattern of PLA/d-HAp nanocomposite after 7 immersion days (curve 4 in figures 5) indicated the characteristic peak of HAp at 2θ = 31.99°. Further, two peaks of PLA crystal at 2θ = 16.53° and 2θ = 18.99° were observed. There was a shift of these peaks in the nanocomposites in the comparison with PLA sample after 7 immersion days in the SBF solution. It can be explained by molecular interaction between d-HAp and PLA such as specific hydrogen bonding between –C=O group in PLA with –OH group of d-HAp and bonding between COO– group in PLA and Ca2+ of d-HAp. This result is completely agreement with the results of change of materials weight aforementioned.
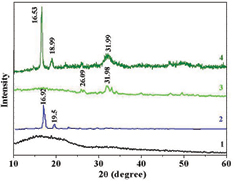
Figure 5. XRD patterns of PLA (1) before and (2) after 7 immersion days, PLA/d-HAp (3) before and (4) after 7 immersion days in SBF solution.
Download figure:
Standard image High-resolution image3.2. In vivo test of PLA/d-HAp nanocomposites
3.2.1. Just after surgery.
3.2.1.1. Incision condition.
After transplant PLA/d-HAp material into the dog femur, all dogs were survival, they recovered at after 1–3 h, ate after 6 h surgery, their locomotions were little and slow in the first 24 h. Figure 6 indicated that 1 d after surgery wound slightly swelled and locally congested, but there was no bleeding. There is no subcutaneous effusion and emphysema. Results on thigh circumference of dog were shown in table 1. It was clear that the thigh circumference of dogs increased after surgery, at 24 h post-operation, thigh circumference reached the greatest value, while the size tended to decrease at 48 h post-operation. This result proves that the process of inflammation after surgery such as swollen, edema has reached its maximum size at 24 h post-operation, but had reduced at 48 h post-operation.
Table 1. Dog's thigh circumference over time.
| Thigh circumference | Point 1 (mm) | Point 2 (mm) | Point 3 (mm) |
|---|---|---|---|
| Before surgery | 112.34 ± 8.92 | 106.56 ± 7.65 | 98.72 ± 8.03 |
| 6 h post-operation | 124.74 ± 12.69 | 116.95 ± 13.23 | 110.94 ± 13.46 |
| 24 h post-operation | 128.32 ± 14.12 | 120.23 ± 15.73 | 115.48 ± 12.94 |
| 48 h post-operation | 125.41 ± 13.57 | 117.24 ± 16.34 | 109.27 ± 10.84 |

Figure 6. The incision in dog's thigh 1 d after surgery.
Download figure:
Standard image High-resolution image3.2.1.2. Body and local temperature.
After surgery, body and thigh temperature of dog increased in comparison with the period before the surgery. The temperatures of body and thigh before surgery are 37.65 ± 0.62 °C and 33.72 ± 0.84 °C, respectively. After surgery, body and thigh temperature of dog are 38.35 ± 0.74 °C and 35.83 ± 0.68 °C. These results were dog body's inflammatory responses after surgery. These early responses after surgery had been shown to enhance the immune response of the dog body, increases the activity of white blood cells (WBC) to foreign antigens intrusion in the body.
3.2.1.3. X-ray image of dog femur after surgery.
Dog's femur x-ray image after surgery was shown in figure 7. It indicated that PLA/d-HAp material areas had lower density than the surrounding medulla and outside cortex of bone. Outer bone cortex had highest density, medulla had lower density than cortex and material had lowest density. In x-ray images, we measured density of the material and compare with that of medulla and cortex of bone. This parameter was used to evaluate the absorption of PLA/d-HAp material in dog's body [24].

Figure 7. X-ray image of dog femur with PLA/mdHAp material.
Download figure:
Standard image High-resolution image3.2.1.4. Hematological parameters.
Three days after surgery, red blood cell (RBC) count and hemoglobin (Hgb) concentration in dog decreased slightly in comparison with those before surgery (table 2), but within normal limits [25]. Some causes such as anesthetics and pain from the wound induced less nutrition that leads to red blood cell and hemoglobin decline. This result shows that surgery had a little effect to the dog and this is an usual result in femur surgery.
Table 2. Dog's hematological indices on third postoperative day.
| Hematological indices | Before surgery | Three days after surgery |
|---|---|---|
| Red blood cell (1012 RBC l−1) | 5.74 ± 0.69 | 5.26 ± 0.74 |
| Hgb (g) in 100 l | 15.62 ± 0.79 | 15.08 ± 0.82 |
| White blood cell* (109 WBC l−1) | 8.93 ± 1.84 | 14.57 ± 3.28 |
| Platelet | 256.36 ± 51.47 | 294.27 ± 63.25 |
White blood cell (WBC) count in dog increased significantly in comparison with that before surgery. After surgery, blood vessels and bone lesions caused acute inflammatory response of the dog body. The cells responsible for phagocytosis process, such as neutrophil, monocyte, lymphocytes were activated, proliferated and entered the bloodstream to approach damage tissues. On the third postoperative day, platelet count increased in comparison with that before surgery (table 3). This is a result of hemostatic process after surgery, the dog body launches blood coagulation to heal and against hemorrhage. This is also a normal reaction of the dog body after clinical interventions [25, 26]. These results showed that there is an acute inflammatory reaction and blood coagulation, but no anemia on the third postoperative day [22]. The results also showed that monocytes increased and lymphocytes declined on the third postoperative day. It indicated that there is an acute inflammatory response against foreign antigens in dog's body. However, this response is moderate, and does not cause serious disturbances to the animals.
Table 3. Count and percentage of the white blood cell.
| White blood cell (WBC) | Count (109 WBC l−1) | Percentage (%) |
|---|---|---|
| Neutrophils | 9.24 ± 1.42 | 63.44 ± 8.94 |
| Eosinophils | 0.76 ± 0.24 | 5.21 ± 2.47 |
| Basophils | 0.00 ± 0.00 | 0.00 ± 0.00 |
| Monocytes | 2.14 ± 0.36 | 14.68 ± 2.75 |
| Lymphocytes | 2.43 ± 0.57 | 16.67 ± 3.86 |
3.2.1.5. ECG parameter on the 3rd postoperative day.
The results in the table 4 showed that duration and amplitude of dog's ECG wave are normal, there were no abnormalities such as ventricular beats, myocardial ischemia, and arrhythmia on dog's ECG on the third postoperative day. The definitions of parameters RR, P, PQ, QT, QRS, T and ST are shown in figure 8.
Table 4. Duration and amplitude of electrocardiogram parameter of dog.
| Electrocardiogram parameter | Pre-operation | Post-operation | ||
|---|---|---|---|---|
| Duration (s) | Ampliture (mV) | Duration (s) | Ampliture (mV) | |
| RR' interval | 0.520 ± 0.094 | 0.500 ± 0.083 | ||
| P wave | 0.050 ± 0.011 | 0.150 ± 0.024 | 0.047 ± 0.008 | 0.160 ± 0.028 |
| PQ interval | 0.090 ± 0.016 | 0.083 ± 0.019 | ||
| QT interval | 0.240 ± 0.042 | 0.210 ± 0.045 | ||
| QRS complex | 0.060 ± 0.012 | 0.920 ± 0.140 | 0.058 ± 0.014 | 0.840 ± 0.170 |
| T wave | 0.130 ± 0.023 | 0.320 ± 0.060 | 0.110 ± 0.018 | 0.340 ± 0.080 |
| ST interval | 0.010 ± 0.002 | 0.012 ± 0.004 | ||
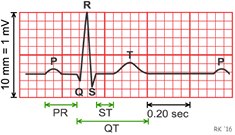
Figure 8. The demonstration of ECG parameters.
Download figure:
Standard image High-resolution image3.2.2. Three months after surgery.
3.2.2.1. Hematological parameter.
Red blood cells, white blood cells, platelet counts and hemoglobin concentration at 3 months after surgery were similar at 1 and 2 months after surgery. Thus, PLA/d-HAp materials existing 3 months in dog's femur did not induce infection or affect to hematopoietic function (table 5). These results were normal and consistent with some previous authors [25, 27].
Table 5. Dog's hematological indices.
| Hematological indices | Time after surgery | ||
|---|---|---|---|
| One month (1) | Two months (2) | Three months (3) | |
| RBC (1012 RBC l−1) | 5.59 ± 0.70 | 5.71 ± 0.58 | 5.80 ± 0.63 |
| Hgb (g) in 100 l | 15.64 ± 0.65 | 15.76 ± 0.84 | 16.14 ± 0.80 |
| WBC (109 WBC l−1) | 9.45 ± 2.21 | 9.26 ± 2.11 | 9.49 ± 2.50 |
| Platelet | 264.34 ± 64.30 | 247.37 ± 72.30 | 258.30 ± 81.30 |
Count and percentage of WBC at 3 months after surgery were similar to those at 2 months after surgery (table 6). These data are equal to normal indices in healthy animal without surgery.
Table 6. Count and percentage of the white blood cell.
| White blood cell (WBC) | Count (g l−1) | Percentage (%) |
|---|---|---|
| Neutrophils | 5.66 ± 1.40 | 58.41 ± 5.56 |
| Eosinophils | 0.74 ± 0.15 | 7.86 ± 1.05 |
| Basophils | 0.29 ± 0.01 | 0.33 ± 0.02 |
| Monocytes | 0.73 ± 0.17 | 7.44 ± 1.71 |
| Lymphocytes | 2.53 ± 0.41 | 25.95 ± 3.68 |
PLA/d-HAp material existing 3 months in femur did not induce chronic infection that presented by neutrophils, monocytes, eosinophils and lymphocytes being in normal range. Further, it did not stimulate allergic and toxicity reactions to the body, presented by no change in eosinophils and basophils. These results clearly demonstrate the biological compatibility of materials in the animal body for long periods.
3.2.2.2. ECG parameter in three months after surgery.
ECG results in 3 months after surgery showed that the heart rate about 103 cycles min−1 (tables 7 and 8). Duration and amplitude of P, T wave, the QRS complex and PQ, QT, ST interval are equal to in 1 and 2 months after surgery and in the normal range of ECG in dogs [28]. These results indicate that the PLA/d-HAp material did not induce abnormal of heart conduction, depolarization of the atria, ventricles and bundle branch.
Table 7. Duration of ECG waves.
| ECG waves | Duration (s) after surgery time of | ||
|---|---|---|---|
| One month (1) | Two months (2) | Three months (3) | |
| RR' interval | 0.560 ± 0.082 | 0.610 ± 0.073 | 0.580 ± 0.062 |
| P wave | 0.052 ± 0.005 | 0.055 ± 0.006 | 0.057 ± 0.005 |
| PQ interval | 0.092 ± 0.017 | 0.095 ± 0.021 | 0.096 ± 0.024 |
| QT interval | 0.250 ± 0.052 | 0.260 ± 0.047 | 0.280 ± 0.052 |
| QRS complex | 0.061 ± 0.012 | 0.059 ± 0.014 | 0.063 ± 0.016 |
| T wave | 0.150 ± 0.027 | 0.140 ± 0.031 | 0.150 ± 0.037 |
Table 8. Amplitude of ECG waves.
| ECG waves | Amplitude (mV) after surgery time of | ||
|---|---|---|---|
| One month (1) | Two months (2) | Three months (3) | |
| P wave | 0.160 ± 0.019 | 0.140 ± 0.022 | 0.170 ± 0.024 |
| QRS complex | 0.960 ± 0.210 | 0.970 ± 0.19 | 0.950 ± 0.240 |
| T wave | 0.340 ± 0.050 | 0.290 ± 0.070 | 0.350 ± 0.090 |
| ST interval | 0.012 ± 0.004 | 0.009 ± 0.005 | 0.014 ± 0.010 |
3.2.2.3. Biochemical indices of liver and kidney function.
Level of glutamic oxaloacetic transaminase (GOT), glutamic pyruvic transaminase (GPT), urea, creatinine, protein and albumin in serum on third postoperative month were the same at first and second postoperative month (table 9). This data showed that the body has adapted to the presence of material and there is no irritation or interaction that affect to liver and kidney function.
Table 9. Biochemical indices of liver and kidney function.
| Biochemical indices | Time after surgery | ||
|---|---|---|---|
| One month (1) | Two months (2) | Three months (3) | |
| GOT (unit l−1) | 33.46 ± 7.44 | 36.17 ± 8.76 | 37.21 ± 7.92 |
| GPT (unit l−1) | 31.79 ± 9.24 | 35.54 ± 8.67 | 33.45 ± 7.58 |
| Ure (mmol l−1) | 3.57 ± 0.71 | 3.84 ± 0.83 | 3.72 ± 0.75 |
| Creatinin (mmol l−1) | 71.12 ± 23.21 | 67.49 ± 19.45 | 81.31 ± 21.38 |
| Protein (g) in 100 l | 8.27 ± 0.42 | 8.29 ± 0.32 | 8.32 ± 0.35 |
| Albumin (g) in 100 l | 4.36 ± 0.21 | 4.21 ± 0.17 | 4.27 ± 0.21 |
3.2.2.4. Image of dog's thigh area and femur after three months of surgery.
In our experiment after 3 months of surgery, the study subjects were healthy, good scar, without the phenomenon of leakage, drainage, material push out and rough skin at the incision. There was no calcification, necrosis in tissue around grafts region. Exposed through the muscle layer, the periosteum can see white material attached to the bone itself and surrounding bone grew into material area (figure 9).

Figure 9. Image of dog's femur with PLA-mdHAp material.
Download figure:
Standard image High-resolution imageThere is no hole and osteonecrosis spot in the bone marrow and the periosteum. Surrounding bone tissues were ripples shore and pressed into the material.
3.2.2.5. Microscope image in PLA/d-HAp area after three months of surgery.
After 3 months of surgery, there is a fewer inflammatory cells (neutrophil, macrophage, monocyte, eosinophil, basophil) exist around material area in femur bone.
Periosteum often has reactions such as thickness, roughness, flaking and shelling in inflammatory area [29, 30]. In this study when observed on periosteal microscopic images, we saw smooth periosteum and no periosteal inflammatory reaction. These results indicated that PLA/d-HAp material had good biological compatibility and did not cause the chronic inflammatory of bone [31].
Microscope images also showed bone formation reaction around material area (figure 10). There were many osteoblasts, collagen fibers and thick-wall blood vessels around material area. This result is similar to the process that occurs on bone healing normally, without complications [32].
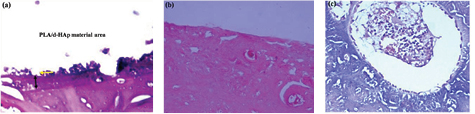
Figure 10. (a) Material area in dog's femur without surrounding inflammatory cell, (b) femur bone cortex without inflammatory reaction and (c) osteoblast activity increased surrounding material area.
Download figure:
Standard image High-resolution image3.2.2.6. Animal weight after three months of surgery.
After 3 months of surgery, under nurtured conditions of animal center, Military Medical University, animal weight was significantly higher than before surgery and 1st month. This result showed that animals were not affected by the surgery and materials in the femur (table 10).
3.2.2.7. X-ray dog's femur image after three months of surgery.
In x-ray image, there is no abnormal morphological in dog's femur at 1st, 2rd and 3rd month after surgery. This result indicated PLA/d-HAp material had high biological compatibility in both phase acute and chronic. It did not induce stimulation, inflammation, rejection reactions on the dog bone site.
In x-ray image, density of PLA/d-HAp material was lowest, bone cortex is highest, medulla was medium. However, over 3 months of surgery the density of PLA/d-HAp material became higher, the difference between the materials and the medulla became increasingly lower. These results demonstrate PLA/d-HAp materials in femur were absorbed increasing gradually over time (figure 11).

Figure 11. X-ray image of dog's femur after 3rd month of surgery.
Download figure:
Standard image High-resolution image
4. Conclusion
The variation pH of SBF solution, material mass, morphology, phase structure of PLA/d-HAp nanocomposites in SBF solution showed the formation of the HAp on the surface of the nanocomposites and the hydrolysis process of PLA after immersion in SBF solution. The in vivo test results of this nanocomposite on femur of dogs during 3 months proved PLA/d-HAp nanocomposites with good biocompabitility and promising potential applications for bone implant.
Acknowledgments
The authors gratefully acknowledge the Ministry of Science and Technology of Vietnam for financial support through the Bilateral Project Vietnam—Korea number 49/2012/HD-NDT.