

Abstract
In this work CoFe2O4 spinel ferrite nanoparticles were synthesized by honey mediated sol-gel combustion method and further annealed at higher temperature 500 °C, 700 °C, 900 °C and 1100 °C. The synthesized spinel ferrite nanoparticles is investigated by x-ray diffraction, Raman spectroscopy, Fourier transform infrared (FTIR) spectroscopy, thermogravimetric analysis/differential scanning calorimetry (TGA/DSC), field emission scanning electron microscopy, x-ray photoelectron spectroscopy and vibrating sample magnetometer. The x-ray diffraction study reveals face-centered cubic spinel cobalt ferrite crystal phase formation. The crystallite size and lattice parameter are increased with annealing temperature. Raman and Fourier transform infrared spectra also confirm spinel ferrite crystal structure of synthesized nanoparticles. The existence of cation at octahedral and tetrahedral site in cobalt ferrite nanoparticles is confirmed by x-ray photoelectron spectroscopy. Magnetic measurement shows increased saturation magnetization 74.4 emu g−1 at higher annealing temperature 1100 °C, high coercivity 1347.3 Oe at lower annealing temperature 500 °C, and high remanent magnetization 32.3 emu g−1 at 900 °C annealing temperature. The magnetic properties of synthesized ferrite nanoparticles can be tuned by adjusting sizes through annealing temperature. Furthermore, the dielectric constant and ac conductivity shows variation with frequency (1–107 Hz), grain size and cation redistribution. The modulus spectroscopy study reveals the role of bulk grain and grain boundary towards the resistance and capacitance. The cole-cole plots in modulus formalism also well support the electrical response of nanoparticles originated from both grain and grain boundaries. The dielectric, electrical, magnetic, impedance and modulus spectroscopic characteristics of synthesized CoFe2O4 spinel ferrite nanoparticles demonstrate the applicability of these nanoparticles for magnetic recording, memory devices and for microwave applications.
Export citation and abstract BibTeX RIS

Original content from this work may be used under the terms of the Creative Commons Attribution 3.0 licence. Any further distribution of this work must maintain attribution to the author(s) and the title of the work, journal citation and DOI.
1. Introduction
Recently, spinel ferrite nanoparticles have been extensively studied due to its interesting properties for various applications [1–3]. Among the spinel ferrites, CoFe2O4 is an attractive material due to its appreciated properties such as high coercivity, moderate saturation magnetization, large magnetocrystalline anisotropy, high electrical resistivity, high magnetostrictive coefficient, good mechanical hardness and chemical stability [4, 5]. It has technological potential applications in high density recording systems, microwave absorbers, targeted drug delivery systems, magnetic resonance imaging contrast agent, high value of the specific absorption rate for hyperthermia treatment, cell separation and detection, catalyst for water splitting, removal of heavy metals from waste water, magnetic switches, chemical sensors, stress and non-contact torque sensors, etc [6–13]. The properties of spinel ferrite nanoparticles are highly sensitive to the various factors such as preparation techniques, particle size, morphology, annealing temperature and cation distribution at tetrahedral and octahedral sites. Bulk CoFe2O4 possesses an inverse spinel structure with Co2+ ions in octahedral site and Fe3+ ions equally distributed between tetrahedral and octahedral sites. However, nanosized CoFe2O4 ferrite nanoparticles exhibit cationic inversion and percentage of presence of Co2+ and Fe3+ ions at both sites depends on the method of preparation of spinel ferrite nanoparticles [14]. The predominant superexchange interaction between the cations at tetrahedral and octahedral sites via oxygen ions influences the magnetic properties of spinel ferrite [15].
In the last decade, spinel ferrite nanostructures have been synthesized by various chemical synthesis methods such as sol-gel, co-precipitation, hydrothermal, solvothermal, sonochemical method, electrochemical, reverse micelles [16–21]. Nowadays, there is a great need to develop simple, cost-effective and environment friendly methods for production of spinel ferrite nanoparticles. Recently, biosynthesis is an alternative synthesis technique to synthesize spinel ferrite nanoparticles. Laokul et al [22] demonstrated the use of a simple synthetic method using cheap precursors of aloe vera plant extract which provides high-yield nanosized ferrites with well crystalline structure and acceptable magnetic properties, and the method is expected to prepare nanocrystalline oxides of other interesting materials. Phumying et al [23] reported synthesis of ferrite nanocrystalline powders using aloe vera plant extract solution in hydrothermal synthesis technique. Moreover, Manikandan et al [24] synthesized ferrite nanoparticles via aloe vera plant extract using microwave combustion method. Wongpratat et al [25] investigated the effect of cations distribution on magnetic properties of Co1−xNixFe2O4 (x = 0, 0.25,0.50, 0.75 and 1.0) nanoparticles synthesized by aloe vera extract solution assisted hydrothermal method. Kombaiah et al [26] studied the microwave assisted and conventional combustion synthesis of hibiscus rosa-sinensis plant extract based ZnFe2O4 nanoparticles and their optical and magnetic properties. The hibiscus rosa-sinensis is an herbaceous plant and the bio-chemical constituents of this plants are taraxerol acetate, β-sitosterol, campesterol, stigmasterol, cholesterol, ergosterol, lipids, citric, tartaric and oxalic acids, fructose, glucose, sucrose, flavonoids and flavonoid glycosides. Sun et al [27] reported magnetic properties of the nanocrystalline CoFe2O4 ferrite thin films prepared by a novel sol–gel method using glucose as an additional agent. Further, Tong et al [28] developed a versatile glucose-engineered precipitation–sintering process for the selective and mass preparation of sponge-like ferrite (M = Fe, Co, Zn, Ni, Mn) micro-polyhedra. In this research group's reported work, glucose acted as a reductant, protecting agent, structure-directing agent and sacrificial template. Furthermore, our research group also investigated the effect of structural changes on magnetic properties of ferrite nanoparticles obtained using starch in sol-gel combustion synthesis [29–31].
It is interesting to study formation and property of spinel ferrite nanoparticles synthesized via a method mediated through natural source of glucose and fructose, i.e. honey. Herein, we used a green synthesis route via honey mediated sol-gel auto-combustion method to prepare CoFe2O4 spinel ferrite nanoparticles. This is a novel way with a unique combination of biological species with an aqueous solution containing salts of desired metals for sol-gel and self-igniting combustion process. The term green synthesis is used since natural honey is used for synthesis of ferrite nanoparticles which act as gelating and reducing agent or fuel for sol-gel auto-combustion synthesis. Honey is sweet viscous fluid made by bees and the major constituents of honey are glucose and fructose [32]. The presence of glucose and fructose in natural honey obviously plays a role on the formation of nanoparticles as viscous medium, protecting agent and natural reductant. The synthesis of ferrite nanoparticles using honey avoids the usage of harmful and toxic reducing agent in combustion method. The use of honey is an environmently friendly, simple and efficient route for formation of cobalt ferrite nanoparticles. In the present work honey is used for synthesis of CoFe2O4 spinel ferrite nanoparticles. Further, the effect of grain size and structural changes on magnetic, dielectric and electrical properties are investigated. Furthermore, the detailed study of modulus and impedance spectroscopy is carried out to reveal the contribution of grain and grain boundary on electrical transport mechanism and relaxation process.
2. Experimental
2.1. Materials and preparation method
The nanoparticles of CoFe2O4 spinel ferrite were synthesized using honey mediated self-propagating sol-gel auto-combustion method. All the chemicals used in our experiments, Fe(NO3)3·9H2O, Co(NO3)2·6H2O were of analytical grade and were purchased from Alfa Aesar GmbH & Co KG, Germany. Honey was product of Australia, made by bees that forage on eucalyptus trees, packed in the UK for Tesco Stores Ltd, Cheshunt, EN8 9SL, UK. In a typical synthesis, Co(NO3)2·6H2O (4.16 g) and Fe(NO3)3·9H2O (11.6 g) were dissolved in distilled water (150 ml) to obtain a mixed solution. An aqueous solution (150 ml) of honey (10 g) was mixed with the metal-nitrate solution. The mixed solution was placed on a hot plate with continuous stirring at 100 °C. During evaporation, the solution formed a very viscous gel. Then the gel was heated to 350 °C to initiate a self-sustaining combustion reaction and produce as-burnt ferrite powder. The main constituents of honey, i.e. glucose and fructose are 'single' sugars or monosaccharides. These monosaccharides have the same molecular formula (C6H12O6), however, the arrangement of atoms are different in each case. When the metal-honey ferrite gel precursor was placed at temperature 350 °C, the decomposition of glucose and fructose with release of gases nitrogen and carbon dioxide occurred and then final product cobalt ferrite powders formed. The following equation represents the decomposition of metal-honey ferrite gel precursors into cobalt ferrite:

Finally, the as-prepared cobalt ferrite nanoparticles powders were additionally annealed in a furnace in air atmosphere at 500 °C, 700 °C, 900 °C and 1100 °C, for 2 h, to achieve different nanosized ferrite samples. The samples as prepared and annealed at 500 °C, 700 °C, 900 °C, 1100 °C were designated as CoH, CoH5, CoH7, CoH9, CoH11, respectively.
2.2. Characterization techniques
The structural characteristics of synthesized cobalt ferrite nanoparticles were investigated using PANalytical Empyrean x-ray diffractometer with Cu-Kα radiation (λ = 1.5406 Å). Raman measurements were performed using Nanofinder-S, SOLAR TII, Ltd, at 488 nm excitation with laser power 13 mW with Ar+ laser excitation source over the range of 150–850 cm−1. Fourier transform infrared (FTIR) spectroscopy of ferrite nanoparticles were recorded using Nicolet iS 50 FTIR spectrometer. The morphology of the synthesized spinel ferrite nanoparticles were studied using a field emission scanning electron microscope (FESEM) model JEOL JSM-7600F, equipped with an energy dispersive spectroscopy (EDS) system. Magnetic hysteresis loops were measured using a vibrating sample magnetometer (VSM 7407, Lake Shore) at room temperature with maximum applied magnetic field of 10 kOe. The thermal analysis was carried out using a simultaneous thermogravimetric and differential thermal analysis (TG-DTA) system using TA Instruments Q600. Cation distribution at octahedral and tetrahedral sites and valence states in samples were investigated by x-ray photoelectron spectroscopy (XPS) using Kratos Analytical Axis Ultra DLD. The dielectric constant and dielectric loss tangent were measured in the frequency range 1–107 Hz at room temperature using a Broadband Dielectric Impedance Analyzer Concept 40 (Novocontrol, Germany). The sample dimension of pellet of ferrite nanoparticles was 20 mm in diameter and 0.5 mm in thickness. The complex impedance measurement was carried out with a standard sample cell BDS 1200 employing RC model.
3. Result and discussion
3.1. Thermogravimetric analysis/differential scanning calorimetry (TGA/DSC) study
Thermal analysis was carried out for cobalt ferrite precursor gel to investigate the honey-mediated sol-gel auto-combustion process for formation of cobalt ferrite nanoparticles. Figure 1 shows TGA/DSC curves of the dried gel of ferrite precursors. The TGA curve exhibits a multi-step weight loss. The weight loss from room temperature to 110 °C is due to loss of residual water in the ferrite precursor gel, which appears on the DSC curve as an exothermic peak at 90 °C [33]. Thereafter, a continuous three-step weight loss is noticed at temperature ranging from 148 °C to 350 °C. This also appears as three broad exothermic peaks at 154 °C, 252 °C, 350 °C on the DSC curve. The first weight loss is attributed to the decomposition of the honey (i.e. fructose and glucose). The second exothermic peak with large weight loss is attributed to the decomposition of the dried ferrite precursor gels which was initiated by oxidation–reduction reaction between the nitrate and honey and evolution of CO2 and NOx gases [34]. The third exothermic peak is attributed to decomposition of the organic residual combustion. There is no further weight loss after 350 °C, therefore, it indicated pure cubic cobalt ferrite spinel phase formation at this temperature via honey mediated sol-gel auto-combustion method.
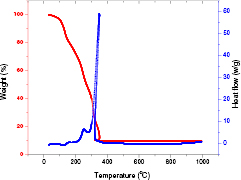
Figure 1. TGA/DSC study of sol-gel ferrite precursors for formation of cobalt ferrite nanoparticles by honey mediated sol-gel auto-combustion method.
Download figure:
Standard image High-resolution image3.2. Structural study
The phase formation of synthesized cobalt ferrite nanoparticles was investigated by powder x-ray diffraction. Figure 2 shows x-ray diffraction (XRD) patterns of CoFe2O4 spinel ferrite nanoparticles synthesized by honey mediated auto-combustion synthesis and further annealed at 500 °C, 700 °C, 900 °C, and 1100 °C.

Figure 2. X-ray diffraction pattern of cobalt ferrite nanoparticles synthesized by honey mediated sol-gel auto-combustion synthesis and further annealed at 500 °C, 700 °C, 900 °C, and 1100 °C.
Download figure:
Standard image High-resolution imageThe presence of diffraction planes (2 2 0), (3 1 1), (2 2 2), (4 0 0), (4 2 2), (5 1 1), (4 4 0) in the diffraction patterns confirms that all the samples exhibit cubic spinel structure having space group Fd3m. All the diffraction peaks are well matched with the standard JCPDS data for CoFe2O4 (22-1086) [35]. The unindexed diffraction peak in CoH7 sample is due to presence of α-Fe2O3 phase [36]. The broad diffraction peak indicated that particles are of nanosize range. It is also noticeable that the diffraction peaks are sharper and narrower with an increase of annealing temperature. This indicated the improvement of crystallinity with increase of annealing temperature 500 °C, 700 °C, 900 °C and 1100 °C. The crystallite size and micro-strain analysis were evaluated using Williamson–Hall method [37]. According to this method, x-ray diffraction peak broadening  . The actual peak broadening (
 ) is obtained by correcting the experimental peak broadening (
 ) and the instrumental broadening (
 ) as
) as  . Hence, XRD peak broadening
  equation can be in modified form as:

where β is full width at half maximum, λ is wavelength of Cu-Kα radiation (λ = 1.5406 Å), ε is strain, and D is crystallite size. The Williamson Hall plots of βcosθ versus 4sinθ for cobalt ferrite nanoparticles are shown in figure 3. A linear plot provides the intercept as the crystallite size and the slope as the strain. The obtained crystallite size and strain of cobalt ferrite nanoparticles are tabulated in table 1. It can be observed that the crystallite size increases with increase of annealing temperature. The size of CoH sample is 20 nm and increases to 88 nm for CoH11 sample. The strain value varies from 1.7 × 10⁻³ for CoH sample to −3.7 × 10⁻⁵ for CoH11 sample.
Table 1. Crystallite size, strain, lattice parameter, x-ray density (dx), radii of tetrahedral and octahedral sites rA and rB, respectively, for cobalt ferrite nanoparticles.
| Sample | Crystallite size (nm) | Strain | Lattice parameter (Å) | dx (gm cm−3) | rA (Å) | rB (Å) |
|---|---|---|---|---|---|---|
| CoH | 20 | 1.7 × 10⁻³ | 8.3817 | 5.292 | 0.5217 | 0.6651 |
| CoH5 | 26 | 8.7 × 10⁻⁴ | 8.3844 | 5.287 | 0.5223 | 0.6657 |
| CoH7 | 40 | 5.6 × 10⁻⁴ | 8.3862 | 5.284 | 0.5227 | 0.6662 |
| CoH9 | 75 | 7.3 × 10⁻⁵ | 8.3875 | 5.282 | 0.5230 | 0.6666 |
| CoH11 | 88 | −3.7 × 10⁻⁵ | 8.3900 | 5.277 | 0.5236 | 0.6672 |

Figure 3. Williamson–Hall plots for cobalt ferrite nanoparticles synthesized by honey mediated sol-gel combustion method.
Download figure:
Standard image High-resolution imageThe lattice constant of CoFe2O4 spinel ferrite nanoparticles has been calculated by d-spacing using the relation [38]

where (h, k, l) are the Miller indices. The lattice constant was found to increase with increase of annealing temperature, as shown in table 1. The increase in lattice constant with annealing obeys Vegard's law [39]. The increase in lattice constant with increase of annealing temperature is associated with variation in microstructure during annealing of material and thermal activated ordering or reordering of cations in cubic spinel structure.
X-ray density (dx) of CoFe2O4 spinel ferrite nanoparticles can be calculated by considering that a basic unit cell of the cubic spinel structure contains 8 ions [40] as follows
where M is the molecular weight of sample, Na is Avogadro's number (6.0225 × 10²³ particles/mole), and a is lattice parameter converted into cm units. The x-ray density (dx) values of CoFe2O4 spinel ferrite nanoparticles are tabulated in table 1. It is found that the density is influenced by the annealing temperature. Density of cobalt ferrite nanoparticles with high values for the small sized particle was observed. Further, the tetrahedral (A)-site radii (rA), octahedral (B)-site radii (rB), hopping length for tetrahedral site (dA), hopping length for octahedral site (dB), tetrahedral and octahedral bond length (dA× and dB×), tetrahedral edge (dA×E), shared and unshared octahedral edge (dB×E and dB×EU) for synthesized cubic CoFe2O4 spinel ferrite nanoparticles are evaluated with lattice constant 'a', oxygen positional parameter 'u' (0.381 Å) and oxygen ion radius Ro from the following equations [41]:


The evaluated values of these structural parameters are tabulated in tables 1 and 2. It is noticeable that the evaluated value of dA and dB increases with increase of grain size of ferrite nanoparticles. The increase in the value of dA and dB with increase grain size is associated with increase in distance between magnetic ions with increase of grain size. It can be also observed that dA ˃ dB; which indicates that the electron hopping between ions at tetrahedral A site and octahedral B site is less probable than that between octahedral B site and octahedral B sites. Furthermore, the evaluated value of rA, rB, dA×, dB×, dA×E, dB×E, dB×EU increases with increase of grain size. It is also associated with cation redistribution on grain size growth.
Table 2. Hopping length (dA) and (dB), tetrahedral bond length (dA×), octahedral bond length (dB×), tetrahedral edge (dA×E), shared (dB×E) and unshared octahedral edge (dB×EU) for cobalt ferrite nanoparticles.
| Sample | dA (Å) | dB (Å) | dA× (Å) | dB× (Å) | dA×E (Å) | dB×E (Å) | dB×EU (Å) |
|---|---|---|---|---|---|---|---|
| CoH | 3.6292 | 2.9629 | 1.9017 | 2.0462 | 3.1051 | 2.8207 | 2.9650 |
| CoH5 | 3.6304 | 2.9639 | 1.9023 | 2.0469 | 3.1061 | 2.8216 | 2.9660 |
| CoH7 | 3.6312 | 2.9645 | 1.9027 | 2.0473 | 3.1068 | 2.8222 | 2.9666 |
| CoH9 | 3.6318 | 2.9650 | 1.9030 | 2.0477 | 3.1073 | 2.8226 | 2.9671 |
| CoH11 | 3.6328 | 2.9658 | 1.9036 | 2.0483 | 3.1082 | 2.8235 | 2.9680 |
3.3. FESEM study
Figure 4 shows the field emission scanning electron microscopy (FESEM) micrographs of cobalt ferrite nanoparticles. It can be observed from FESEM image that CoH sample nanoparticles were spherical with particle size range 10–25 nm, as shown in figure 4(a). Further, it is also evident that particle size increases with annealing temperature. The CoH7 sample nanoparticles were with grain size 20–120 nm, whereas CoH11 sample nanoparticles were in the range of 70–150 nm, as ahown in figures 4(b) and (c). Figure 4(d) shows the typical EDX spectrum of the representative cobalt ferrite sample. This spectrum marks the presence of Co, Fe and O which further confirms the formation of pure CoFe2O4 spinel ferrite.
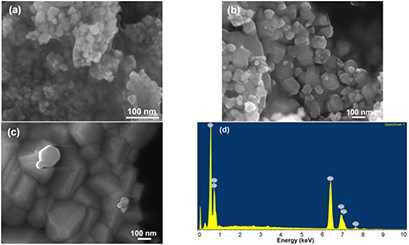
Figure 4. Cobalt ferrite nanoparticles with FESEM images (a) as prepared, (b) annealed at 700 °C, (c) annealed at 1100 °C, and EDX pattern (d).
Download figure:
Standard image High-resolution image3.4. Raman spectroscopy
Raman spectroscopy is a powerful technique for investigating the atomic structure of nanoparticles [42]. Figure 5 shows the Raman spectra of CoFe2O4 spinel ferrite nanoparticles. Group theory analysis predicts the following optical phonon distribution: 5T1u + A1g + Eg + 3T2g, in which, the 5T1u modes are IR active, whereas the other five (A1g + Eg + 3T2g) modes are Raman active composed to the motion of O ions and both A-site and B-site ions in the spinel structure [43]. Furthermore, the A1g mode is associated to symmetric stretching of the oxygen anion, the Eg mode is associated to symmetric bending of the oxygen anion, and the T2g mode is due to asymmetric stretching of the oxygen anion with respect to the tetrahedral and octahedral cations [44]. It can be seen from figure 5 and table 3 that as synthesized CoFe2O4 spinel ferrite nanoparticles shows Raman modes at ~198, ~297, ~461, ~558, ~604 and 680 cm−1. Raman modes at around 680 cm−1 shows a shoulder like feature at the lower wavenumber side (~604 cm−1). These bands were assigned to A1g(1) and A1g(2) modes, demonstrating the stretching vibrations of the Fe–O amd M–O bonds in tetrahedral sites. The lower frequency Raman modes (~198, ~297, ~461, and ~558 cm−1) were assigned to the T2g and Eg Raman modes, demonstrating the vibration of the spinel structure. It is also noticeable from figure 5 and table 3 that there were a little shift in Raman modes with increase of annealing temperature. It was associated with increase of particle size and cation redistribution in CoFe2O4 spinel ferrite annealed samples [42–44]. The cation redistribution can be noticed by comparing the relative intensities of the A1g(1) and A1g(2) modes. The change in ratio of intensity with increase of annealing temperature is observed and it is tabulated in table 3.
Table 3. Raman modes for cobalt ferrite nanoparticles.
| Sample | Raman peak (cm−1) | Ratio of intensity  |
|||||
|---|---|---|---|---|---|---|---|
| A1g(1) | A1g(2) | T2g(1) | T2g(2) | Eg | T2g(3) | ||
| CoH | 680 | 604 | 558 | 461 | 297 | 198 | 1.388 |
| CoH5 | 680 | 603 | 561 | 463 | 287 | 221 | 1.433 |
| CoH7 | 672 | 587 | 562 | 464 | 276 | 214 | 1.173 |
| CoH9 | 678 | 599 | 559 | 460 | 287 | 217 | 1.447 |
| CoH11 | 685 | 603 | 563 | 463 | 301 | 204 | 2.420 |

Figure 5. Raman spectra of cobalt ferrite nanoparticles at different annealing temperatures.
Download figure:
Standard image High-resolution image3.5. FTIR spectroscopy
The FTIR spectra of CoFe2O4 spinel ferrite nanoparticles were recorded in 75–900 cm−1 range, are as shown in figure 6. The positions of the vibrational bands of CoFe2O4 spinel ferrite are tabulated in table 4. In spinel ferrite structure, the vibrational band around 550 cm−1 corresponds to the stretching vibration of tetrahedral group and the vibrational band around 350 cm−1 corresponds to the stretching vibration of octahedral groups [45]. From figure 6 and table 4, it can be seen that the FTIR spectra consist of two major absorption bands, the first at about 550 cm−1 (ν1) and the second one at about 350 cm−1 (ν2). These absorption bands further confirm the formation of CoFe2O4 spinel ferrite structure. A small shift in the absorption bands of the tetrahedral and octahedral sites can be observed from figure 6. The force constant, which is proportional to atomic number of metal ions, atomic number of oxygen ions and metal-oxygen bond length, is associated with the shift of absorption band position due to tetrahedral (A) sites and octahedral (B) sites, respectively [46]. Further, the value of force constant, namely, FT and FB for the tetrahedral (A) and the octahedral (B) sites, respectively, are evaluated from the following equation [47]

where F is the force constant, c is the light velocity 2.99 × 10⁸ m s−1, ν is the vibration frequency of the A and B sites, µ is the reduced mass for the Fe3+ ions and the O2− ions (~2.065 × 10⁻²⁶ kg mol−1). The evaluated value of force constant is tabulated in table 4. The value of force constant for tetrahedral site was in the range of 2.08 × 10² N m−1–1.97 × 10² N m−1, whereas it was 0.82 × 10² N m−1 − 0.66 × 10² N m−1 for octahedral site. The variation of force constant is associated with cations redistribution among tetrahedral and octahedral sites with variation of grain size [48].
Table 4. The frequency ν1 and ν2 and force constant FT and FB for the tetrahedral and octahedral sites, respectively, for cobalt ferrite nanoparticles.
| Sample | ν1 (cm−1) | ν2 (cm−1) | FT × 102 (N m−1) | FB × 102 (N m−1) |
|---|---|---|---|---|
| CoH | 533 | 334 | 2.08 | 0.82 |
| CoH5 | 529 | 333 | 2.05 | 0.81 |
| CoH7 | 523 | 327 | 2.00 | 0.78 |
| CoH9 | 521 | 314 | 1.99 | 0.72 |
| CoH11 | 519 | 301 | 1.97 | 0.66 |

Figure 6. FTIR spectra of cobalt ferrite nanoparticles at different crystallite sizes.
Download figure:
Standard image High-resolution image3.6. XPS study
XPS measurements were carried out to investigate electronic state and cation distribution. It can be observed from figures 7(a) and (c), that the high resolution Co 2p XPS spectra of CoH5 and CoH11 sample is associated with two spin–orbit doublets characteristics of Co 2p3/2 and Co 2p1/2 and two shakeup satellites [49]. Figure 7(a) shows two peaks situated at ~780 eV and ~795 eV, corresponding to the Co 2p3/2 and Co 2p1/2 for Co2+ state, which confirm that the valence state of cobalt is 2. Further, for CoH5 sample, the Co 2p3/2 peak is deconvoluted into two peaks situated at 780.2 and 782.6 eV (figure 7(a)), corresponding to Co in two crystallographic environment, i.e. octahedral and tetrahedral sites in spinel ferrite. The deconvoluted two peaks have binding energies at 780.2 and 782.6 eV, which is associated with Co2+ ions at octahedral sites and tetrahedral sites, respectively. In accordance with integrated intensity of deconvoluted peaks, the distribution of Co2+ ions is 70% at octahedral sites and 30% at tetrahedral sites. Similarly, for CoH11 sample, the Co 2p3/2 spectra is also deconvoluted into two peaks situated at 780.1 and 782.0 eV (figure 7(c)). The binding energies of deconvoluted peaks at 780.1 and 782.0 eV are assigned to Co2+ ions at octahedral sites and tetrahedral sites, respectively. In CoH11 sample, the distribution of Co2+ ions is 66% at octahedral sites and 34% at tetrahedral sites. Further, from figures 7(b) and (d) it can also be observed that the high resolution Fe 2p spectra of CoH5 and CoH11 sample, is associated with two spin–orbit doublets characteristics of Fe 2p3/2 and Fe 2p1/2 and two shakeup satellites [50]. Two peak situated at ~711 eV and ~725 eV represent the Fe 2p3/2 and Fe 2p1/2 for Fe3+ state, confirming that the valence state of iron is 3. Furthermore, with the integrated intensity of deconvoluted peaks, the distribution of Fe3+ ions is 76% at octahedral sites and 24% at tetrahedral sites in CoH5 sample, whereas, it is 77% at octahedral sites and 23% at tetrahedral sites in CoH11 sample. Therefore, the occupation formula for CoFe2O4 nanoparticles can be described as follows

for CoH5 sample and

for CoH11 sample.
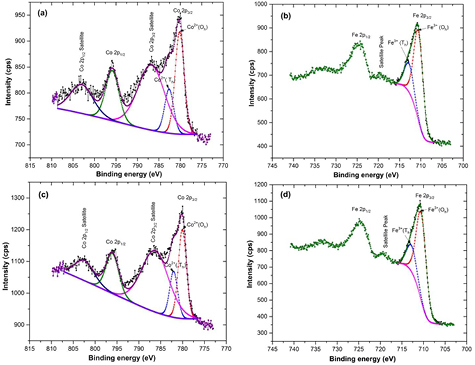
Figure 7. XPS spectra of cobalt ferrite nanoparticles: (a, b) annealed at 500 °C, and (c,d) annealed at 1100 °C.
Download figure:
Standard image High-resolution image3.7. Magnetic properties
Figure 8 shows the variation of magnetization as a function of applied magnetic field for cobalt ferrite nanoparticles at room temperature. The hysteresis curves show the variation of magnetization with variation of grain size of ferrite nanoparticles. The evaluated value of variation in magnetic parameters such as saturation magnetization (Ms), remanence magnetization (Mr) and coercivity (Hc) are tabulated in table 5. Further, the experimental magnetic moment (ηB) was evaluated in accordance with the following relation [41]:
where M is the molecular weight. Moreover, the anisotropy constant is evaluated using following relation [51]
where K is anisotropy constant.
Table 5. Saturation magnetization, coercivity, remanent magnetization, magnetic moment, remanence ratio Mr/Ms, anisotropy constant for cobalt ferrite nanoparticles.
| Sample | Ms (emu g−1) | Hc (Oe) | Mr (emu g−1) | ηB (µB) | Mr/Ms | K × 103 (emu · Oe g−1) |
|---|---|---|---|---|---|---|
| CoH | 40.6 | 901.2 | 14.2 | 1.71 | 0.35 | 38.11 |
| CoH5 | 50.4 | 1347.3 | 20.6 | 2.12 | 0.41 | 70.73 |
| CoH7 | 51.9 | 1192.5 | 23.9 | 2.18 | 0.46 | 64.46 |
| CoH9 | 72.9 | 964.9 | 32.3 | 3.06 | 0.44 | 73.27 |
| CoH11 | 74.4 | 901.2 | 28.1 | 3.13 | 0.37 | 69.84 |

Figure 8. Hysteresis curve of cobalt ferrite nanoparticles at different crystallite sizes.
Download figure:
Standard image High-resolution imageIn ferromagnetic materials, the magnetization will not pass through origin, however, a magnetization versus applied magnetic field (M–H) loop, is formed. Figure 8 indicates ferromagnetic behaviour of CoFe2O4 nanoparticles. Since, the M–H loops do not pass through the origin, therefore, at zero applied magnetic field, it retains a magnetization value, and it is the remnent magnetization (Mr). Coercivity is a measure of the magnetic field that has to be applied in a reverse direction to coerce the remnant magnetization back to zero, and it is the applied magnetic field value when the hysteresis loop crosses zero magnetization [52].
It was observed that the saturation magnetization increases from 40.6 emu g−1 to 74.4 emu g−1 with increase of grain size (figure 8 and table 5). The decrease in the value of saturation magnetization of ferrite nanoparticles with decrease of grain size is due to surface spin disorder or spin canting effects [53, 54]. Similar obsevations were also noticed on other spinel ferrite nanoparticles in previous report of researchers [55, 56]. Furthermore, Abdallah et al [57] reported that the enhanced saturation magnetization with annealing of CoNiFe2O4 nanoparticles can be associated with modification of crystallite size and ionic population of Fe3+ at octahedral site. Nikam et al [41] reported that the increase in saturation magnetization of non-magnetic Zn ion doped CoFe2O4 is due to migration of Fe3+ ions from tetrahedral A site to octahedral B sites. Further, the magnetic ordering in spinel ferrites is associated with super-exchange interaction between the magnetic ions in the tetrahedral (A) and octahedral (B) sublattices, mediated by oxygen ions. In consideration of Néel's two sublattice model, the magnetic moment of ions on the tetrahedral (A) and octahedral (B) sublattices are aligned antiparallel to each other and their spins have a collinear structure. Therefore, the total magnetization is MB–MA (MB and MA are the sum of the magnetic moments on B sublattice and A sublattice, respectively) [58]. In this report, the saturation magnetization increases with grain size. The variation of magnetic moment with grain size can also be explain on the basis of cation distribution and the strength of the super-exchange interaction between the ions on the tetrahedral (A) and octahedral (B) sublattices. In present work, the XPS study revealed the migration the Fe3+ ions from tetrahedral (A) sites to octahedral (B) sites with increase of grain size of cobalt ferrite nanoparticles. Therefore, the magnetic moment of B site increases due to increase of Fe3+ ions in B sites. It also causes the increase in magnetization of CoFe2O4 nanoparticles with grain size.
In addition, the remanence ratio Mr/Ms is the characteristic parameter of magnetic materials and provides information by which the direction of magnetization reorients to the nearest easy axis magnetization direction after the magnetic field switch off [37]. In the present study the calculated value 0.35–0.46 of remanence ratio Mr/Ms, as tabulated in table 5, indicates anisotropic nature of CoFe2O4 nanoparticles. Furthermore, the increase in coercivity (Hc) of CoFe2O4 nanoparticles is observed as a function of crystallite size. The coercivity is increased with increase of grain size from 901.2 Oe (20 nm) to 1347.3 Oe (26 nm) and then further decreased to 901.2 Oe (88 nm). The increase in coercivity is result of increase of anisotropy energy with increase of particle size [59]. However, further decrease in coercivity is due to the expected crossover from single domain to multidomain as particle size increases with annealing temperature [60]. In present work the observed maximum coercivity 1347.3 Oe is higher than bulk coercivity (980 Oe) of cobalt ferrite [61]. Since, in a single domain nanoparticles, the reversal of the magnetization occurs via coherent rotation of magnetization, where there is no domain wall. As the domain wall motion is easier than the rotation of magnetization, therefore, the coercivity is larger in single domain nanoparticles [62].
3.8. Dielectric properties
3.8.1. Dielectric constant.
The frequency dependence of real part ( ) and imaginary part (
 ) of dielectric constant of cobalt ferrite nanoparticles is shown in figure 9. It can be noticed from figure 9 that dielectric constant decreases with increase of frequency. It decreases rapidly at lower frequency from 1 Hz to 100 Hz and then decreases slowly at higher frequency. The high value of dielectric constant at lower frequency is associated with the contributions from ionic, space charge and interface polarization. At higher frequency, dielectric constant becomes independent of frequency. It is due to the inability of electric dipoles to follow the fast variation of the applied electric field [63]. The decrease of dielectric constant with frequency can be explained on the basis of Koop's theory [64], which assumes the dielectric structure as an inhomogeneous medium of two layers of the Maxwell–Wagner type [65]. This model assumes that the dielectric structure is consisting of well conducting grains, separated by poorly conducting grain boundaries. Moreover, at lower frequencies the grain boundaries are more effective for dielectric constant and conductivity than grain. Consequently, dielectric constant is high at lower frequency and decreases with increase of frequency [66]. In spinel ferrite, the polarization is through a mechanism similar to conduction process. The polarization in cobalt ferrite is associated with the hopping of charge carriers and thereby at low frequency, the charge carriers reaching at grain boundaries pile up there, because of the higher resistance, and produce polarization. As the frequency of the applied ac electric field increases, the charge carriers cannot follow the frequency of the applied ac electric field and thereby decrease in polarization [67]. The observed values of dielectric constants
  and
and  at 100 Hz and 1 kHz are tabulated in table 6. The value of dielectric constant
  lie within the range 7.2–32.0 at 100 Hz and 4.8–12.1 at 1 kHz at room temperature. Moreover, the value of dielectric constant
  lie within the range 5.6–108.9 at 100 Hz and 1.6–16.0 at 1 kHz. The variation of dielectric constant is due to variation in cation distribution with variation of microstructure and grain size [68].
Table 6. Dielectric parameters viz.  ,
,  , tanδ, and ac conductivity at 100 Hz and 1 kHz frequency for cobalt ferrite nanoparticles.
| Sample |  |
 |
tanδ | σ × 10−9 (S cm−1) | ||||
|---|---|---|---|---|---|---|---|---|
| 100 Hz | 1 kHz | 100 Hz | 1 kHz | 100 Hz | 1 kHz | 100 Hz | 1 kHz | |
| CoH | 32.0 | 8.6 | 108.9 | 15.0 | 3.3 | 1.8 | 5.8 | 8.2 |
| CoH5 | 9.5 | 5.7 | 9.0 | 2.3 | 0.9 | 0.4 | 0.4 | 1.1 |
| CoH7 | 13.8 | 7.3 | 22.7 | 5.0 | 1.6 | 0.7 | 1.2 | 2.6 |
| CoH9 | 28.2 | 12.1 | 98.6 | 16.0 | 3.4 | 1.4 | 5.3 | 8.8 |
| CoH11 | 7.2 | 4.8 | 5.6 | 1.6 | 0.8 | 0.3 | 0.3 | 0.8 |

Figure 9. Frequency dependent real part ( ) of dielectric constant of cobalt ferrite nanoparticles. Inset is frequency dependete imaginary part (
 ) of dielectric constant.
Download figure:
Standard image High-resolution image3.8.2. Dielectric loss.
The variation of dielectric loss (tanδ) with frequency (1–107 Hz) for cobalt ferrite nanoparticles is shown in figure 10. In polycrystalline spinel ferrite, the dielectric loss is associated with lag in polarization with respect to the applied ac electric field and may be caused by the grain boundaries, impurities, and imperfections in the spinel ferrite crystal lattice. When the frequency of the external a.c. electric field is equal to the hopping frequency of the charge carriers, the maximum electrical energy is transferred to the oscillating ions, thereby, we can notice a peak in power loss [69], as observed in figure 10. The condition for maximum in the dielectric loss in the material is ωτ = 1, where ω = 2πf. The relaxation time (τ) is related to the jumping probability per unit time (p), as τ = 1/2p, or ωmax = 2p [70]. In spinel ferrite, conduction mechanism occurs with both type of charge carriers, i.e. n-type and p-type. The n-type charge transfer occurs due to hoping of electrons between Fe2+ and Fe3+ ions; and p-type charge transfer occurs between Co2+ and Co3+ ions. The Debye relaxation process occurs when the rate of hopping becomes approximately equal to the frequency of the applied ac electric field. The observed value of dielectric loss (tanδ) at 100 Hz and 1 kHz frequency for synthesized ferrite nanoparticles is tabulated in table 6. In present study the value of dielectric loss (tanδ) is 0.4 and 0.3 for CoH5 and CoH11 sample, respectively, at room temperature at a frequency of 1 kHz. The synthesized cobalt ferrite nanoparticles are more suitable for microwave applications due to low dielectric loss.
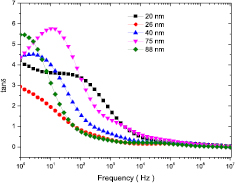
Figure 10. Frequency dependent dielectric loss of cobalt ferrite nanoparticles.
Download figure:
Standard image High-resolution image3.9. AC conductivity
In spinel ferrite the conduction mechanism can be described by the Verwey mechanism [71]. In accordance with this mechanism, the conduction in ferrites is due to the hopping of electrons, among the ions of the same element having different valence state at the octahedral (B) site. In spinel ferrite the electron exchange between Co2+ and Fe3+ ions can be given by the following equation [72–75]

Figure 11 illustrates frequency dependence of ac conductivity of cobalt ferrite nanoparticles. In general, the total conductivity is in accordance with following relation [76]

where σo(T) is dc conductivity due to band conduction and it is frequency independent part, σ(ω, T) is ac conductivity due to hopping process among ions of same element present in more than one valence state. In above relation, the B and s are constants which depends on both temperature and composition. From figure 11 it is noticeable that there is frequency independent behaviour at low frequency. It is related to dc conductivity and associated with grain boundaries, which are more effective with high resistance at low frequency. Further, there is frequency dependent conductivity at high frequency, which corresponds to ac conductivity. The increase in ac conductivity with increase of higher frequency can be also notice from figure 11. The increase in conductivity with increase in frequency is associated with the magnitude of the electronic exchange of Fe2+/Fe3+ ion pairs exist at the octahedral (B) sites in cobalt ferrite nanoparticles. Moreover, the value of ac conductivity lies in the range 0.8 × 10⁻⁹ S cm−1 to 8.8 × 10⁻⁹ S cm−1 at room temperature at a frequency of 1 kHz, as tabulated in table 6. Whereas, it lies in the range 0.3 × 10⁻⁹ S cm−1 to 5.8 × 10⁻⁹ S cm−1 at a frequency of 100 Hz. The variation in ac conductivity of cobalt ferrite with variation of grain size can be noticed from figure 11 and table 6. This behaviour is associated to the decrease in the concentration of Fe2+/Fe3+ ion pairs with variation of cation distribution This variation in cation distribution is associated with grain size. Further, it is also due to variation in grain size and microstructure, which influences the number of grain boundary and thereby resistivity of the material. Furthermore, the frequency dependence of ac conductivity can be also understood with the help of the Maxwell–Wagner two layer model. In view of this model, grain boundaries are more active at lower frequencies, thereby, the hopping frequency of the electron between Fe2+ and Fe3+ ion is less at lower frequency. The conductive grains become more active with increase of frequency of applied field, and therefore, promoting electron hoping between two adjacent octahedral sites and a transition between Fe2+ and Fe3+ ions. Consequently, ac conductivity increases gradually with frequency of applied field [63].
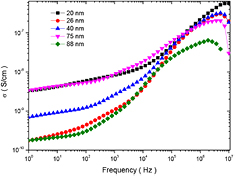
Figure 11. Frequency dependent ac conductivity of cobalt ferrite nanoparticles.
Download figure:
Standard image High-resolution image3.10. Modulus and impedance spectroscopy
With the variation of frequency of applied field, the role of the conductive grain and poorly conducting grain boundaries changes, thereby, promotion of hopping between Fe2+ and Fe3+ altered. Therefore, it is important to understand the conduction mechanism whether it is due to the grain or grain boundary. Measurement of frequency dependent real  and imaginary
  parts of modulus spectrum is excellent technique to analyse the relaxation mechanism and contribution of both grain and grain boundary in the transport property. The impedance spectroscopy is also convenient and powerful technique that enables us to correlate the dielectric properties of material with the microstructure. Figure 12 shows the frequency dependent real part of modulus
  and impedance
  spectra for cobalt ferrite nanoparticles. It can be notice from figure 12, that the value of real part of modulus
  is very low at low frequency and with increase of frequency it has continuous increase in dispersion with tendency to saturate at a maximum asymptotic value. This represents short range mobility of charge carriers in conduction mechanism. It is associated with a lack of restoring force responsible for mobility of charge carriers under the action of an induced electric field. This characteristic suggests negligible contribution of electrode polarization in the material [77]. Moreover, figure 12 also shows that the resistance
  decreases with increase of frequency of the applied ac electric field, showing that the conduction is promoted by applied ac field.

Figure 12. Frequency dependent real part of modulus  and real part of impedance
  spectra for cobalt ferrite nanoparticles.
Download figure:
Standard image High-resolution imageFigure 13 shows the variation of imaginary part of modulus  and impedance
  spectra with frequency for cobalt ferrite nanoparticles. From figure 13, it can be observed that the
  shows maxima
  peaks at a particular frequency (i.e. relaxation frequency, fmax). The existence of a peak in the modulus spectrum indicates conductivity relaxation mechanism. The asymmetric broadening of
  peak indicates the conduction mechanism is of non-Debye type [78]. The low frequency side of
  peak represents the range of frequencies in which the charge carriers can move over long distance, whereas the high frequency side of
  peak indicates the range of frequencies in which the charge carriers are spatially confined to their potential wells and therefore, could be made to have localized motion within the well [79]. The region of maximum relaxation frequency indicates a transition from a long range to short range mobility of ions with increase in frequency of applied field. Moreover, figure 13 also shows that the reactance
  decreases with increase of frequency of the applied field. It indicates the conduction is indorsed by applied ac field.
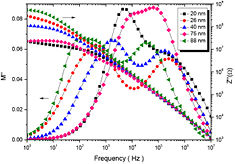
Figure 13. Frequency dependent imaginary part of modulus  and imaginary part of impedance
  spectra for cobalt ferrite nanoparticles.
Download figure:
Standard image High-resolution imageIn general, the cole–cole ( versus
  ) plot of polycrystalline material is characterized by the appearance of one or more semicircles depending upon the presence of the number of relaxation effects. The cole–cole plot of modulus formalism is more effective than impedance formalism (
 versus
  ) for precisely separating the relaxation effects from grain and grain boundary in nanostructured spinel ferrite material. This is because imaginary part of impedance
  represents the relaxation dynamics from largest resistance of the material, whereas, imaginary part of the modulus
  represents the smallest capacitance (i.e. the highly conductive part) of the material [80]. Figure 14 shows the cole–cole (
 versus
  ) plot for cobalt ferrite nanoparticles. The appearance of two semicircular peak in the cole–cole (
 versus
  ) plot indicates the presence of two type of relaxation phenomenon with different relaxation time (τ), associated with each relaxation. The relaxation time τ is related to the frequency maximum in the modulus spectra, which can reveal the long range or short range migration of charge carriers in the material [81]:

Figure 14. Cole–cole ( versus
  ) plot for cobalt ferrite nanoparticles.
Download figure:
Standard image High-resolution image
Moreover, it is well known that the peak height in  versus frequency plot is inversely proportional to the capacitance. The capacitance values can be calculated at the maximum frequency (fmax) using the following relation [82]:

Furthermore, the resistance values can be estimated at the maximum frequency (fmax) using the following relation [83]:

The parameters Rg, Cg and τg correspond to the resistance, capacitance, and the relaxation time of the grain and Rgb, Cgb and τgb corresponding parameters for grain boundary are evaluated and tabulated in table 7. The evaluated values of grain resistance (Rg) lie within the range 7.2 kΩ–66 kΩ, while the grain boundary resistance (Rgb) lie within the range 240 kΩ–15 000 kΩ. Further, the evaluated values of grain capacitance (Cg) lie within the range 51 pF–84 pF, and grain boundary capacitance (Cgb) in the range of 52 pF–70 pF. Moreover, the evaluated grain boundary relaxation time (τgb) was lie within the range 13 µs–980 µs. Whereas, grain relaxation time (τg) was within the range 0.57 µs–4.60 µs.
Table 7. Mean value of relaxation time at grain (τg) and grain boundary (τgb), grain capacitance (Cg) and grain resistance (Rg), grain boundary capacitance (Cgb) and grain boundary resistance (Rgb) for cobalt ferrite nanoparticles.
| Sample | τg (µs) | τgb (µs) | Rg (kΩ) | Rgb (kΩ) | Cg (pF) | Cgb (F) |
|---|---|---|---|---|---|---|
| CoH | 0.57 | 31 | 7.2 | 600 | 79 | 52 |
| CoH5 | 0.61 | 380 | 7.3 | 5300 | 84 | 70 |
| CoH7 | 0.94 | 99 | 13 | 1500 | 75 | 67 |
| CoH9 | 2.50 | 13 | 48 | 240 | 51 | 53 |
| CoH11 | 4.60 | 980 | 66 | 15 000 | 69 | 67 |
4. Conclusion
In summary, a simple honey mediated self-sustaining sol-gel combustion method is used to prepare CoFe2O4 nanoparticles with controlled size and morphology. The powder x-ray diffraction study revealed the structural phase formation of CoFe2O4 spinel ferrite nanoparticles. Raman and FTIR spectroscopy confirmed the presence of tetrahedral and octahedral sites in synthesized CoFe2O4 spinel ferrite nanoparticles. The migration of cations due to annealing is noticed by XPS. The significant influence of the grain size and structural changes on magnetic, dielectric, electrical, impedance and modulus spectroscopic characteristics of cobalt ferrite nanoparticles is noticed. The tuning in magnetic parameters such as saturation magnetization, coercivity, anisotropy constant was found due to crystallite size effect and cation distribution. The observed maximum coercivity 1347.3 Oe was higher than bulk coercivity (980 Oe) of cobalt ferrite. The variation in dielectric constant and ac conductivity was noticed with frequency, grain size and cation redistribution. The cole-cole plot through modulus spectroscopy brought out the role of bulk grain and grain boundary towards the resistance and capacitance. Furthermore, the reported honey mediated sol-gel combustion method provides cost effective and green synthesis alternative for mass scale production of CoFe2O4 nanoparticles.
Acknowledgment
This work was supported by the Ministry of Education, Youth and Sports of the Czech Republic—Program NPU I (LO1504).