

Abstract
In this paper we review the results of the research and development of photonic structure devices performed in the Institute of Materials Science in the period from 2010–2015. We have developed a configuration of 1D photonic crystal (PC) microcavities based on porous silicon (PS) layers and applied them to optical sensing devices that can be used for the determination of organic content with a very low concentration in different liquid environments. Various important scientific and technological applications of photonic devices such as the ultralow power operation of microcavity lasers, the inhibition of spontaneous emissions and the manipulation of light amplification by combining the surface plasmonic effect and the microcavity are expected. We developed new kinds of photonic structures for optical filters based on guided-mode resonances in coupled slab waveguide gratings, which have great potential for application in fiber-optic communication and optical sensors.
Export citation and abstract BibTeX RIS

Original content from this work may be used under the terms of the Creative Commons Attribution 3.0 licence. Any further distribution of this work must maintain attribution to the author(s) and the title of the work, journal citation and DOI.
1. Introduction
The research on photonic micro and/or nanostructures has developed considerably with the applications in optical communications and sensing techniques. Among the photonic structures, the microcavity can be used for fabricating compact light sources, micro-size devices for optical communication such as wavelength converters, optical switching and filtering and highly sensitive optical sensors. A microcavity is an optical resonator close to or below the dimension of the wavelength of light. Micrometer and submicrometer-sized resonators use two different schemes to confine light. In the first, the reflection off a single metallic surface (mirror) or from a total internal reflection between two dielectrics is used. The second scheme is to use microstructures periodically patterned on the scale of the resonant optical wavelength, for example a planar multilayer Bragg reflector with a high reflectivity, or a photonic crystal (PC) [1]. An alternative approach for microcavities uses total internal reflection within a highly refractive index convex body to produce whispering-gallery modes (WGMs), that can exist within spheres (3D modes), or disks and rings (2D modes), or more complicated topological structures. Finally, PCs employ periodic patterning in one, two or three-dimensions to confine light to a small volume surrounding a defect of the structure. The main characteristics of microcavities include the following: their optical finesse, their coupling efficiency to incident light, their optical mode volume, their incorporation of active emitters and their fabrication complexity.
In this paper we review the results of the research and development of photonic structure devices based on microcavities, performed in the Institute of Materials Science (IMS) in the period from 2010–2015. We had developed a configuration of a 1D PC microcavity based on porous silicon (PS) layers and applied it to an optical sensing device that can be used for the determination of organic content with a very low concentration in a liquid environment. Various important scientific and technological applications of photonic devices such as the ultralow power operation of a microcavity laser, the inhibition of spontaneous emissions and the manipulation of light amplification by combining the surface plasmonic effect and the microcavity are expected. We have therefore developed new kinds of photonic structures for optical filtering based on guided-mode resonances in coupled slab waveguide gratings, which have great potential for application in fiber-optic communication and optical sensors.
2. Nanoporous silicon microcavity sensor to determine organic solvents and pesticides
Porous silicon microcavities (PSMs) allow us to realize convenient and low-cost optical devices that can determine the organic solvents and pesticide content with a very low concentration in liquid solutions; in this way, PSM devices show promise for simple and portable instruments for liquid-phase environment pollutant monitoring. Owing to its high specific surface area [1], PS is an ideal transducer material for sensors of liquids [2, 3] and vapors [4, 5]. Recently, PS optical sensors have been designed in the structure of one-dimensional PC devices such as optical filters [6] and microcavities [7]. The principle aim of these sensors is to determine the PC spectral shift caused by the refractive index change of the nanoporous silicon layers in the device due to the interaction with the liquid or gas. It is based on the principle that the response of the sensor is only dependent on the refractive index and therefore lacks specificity for the studied substances. It is possible to use a physical or chemical method to overcome this drawback. A commonly used chemical method is the functionalization of the surface of silicon nanocrystals in the porous layers [8, 9]. It is a chemical process to create the new chemical bond that combines selectively with molecules of the studied substances. The number of published works, which have used a physical method to identify the analyses, in sensors based on PCs has been limited. Sailor applied temperature cycles to a porous silica photonic crystal embedded in pure chemical vapors and therefore he was able to distinguish between isopropanol, heptane, and cyclohexane [10]; Patel et al have shown the detection of glucose and methyl parathion by nanoscale PSM sensors [11, 12]. The sensitivity and selectivity of the optical sensors can be enhanced by designing suitable structural parameters such as thickness, porosity, the number of porous layers in the device [13, 14] or creating a stress on the sensor surface [15].
In this section we present an overview of the developed method using a PSM sensor for the determination of organic solvents and pesticides such as atrazine with a very low concentration in the water. We set up the measurement, in which the temperature of the solution and the velocity of the airflow containing the solvent gas from solutions of ethanol and acetone, control the response of the sensor. As mentioned above, the sensor uses the physico-chemical properties of the analyzed substances as 'characteristic signals' involved in the response of the sensor. The sensor response is given by the shift of the resonant wavelength of the microcavity when the sensors are immersed in the flow of solvent vapor. We present a study of the dependence of the wavelength shift on the solvent concentration, the velocity of the airflow and the solution temperature. Considering these dependencies, we hope to find out the potential to enhance the sensitivity of the sensors and the specificity of the measurement.
2.1. Experimental
PSMs were fabricated by an electrochemical method in a process that was presented in our previous work [16]. In particular, the electrochemical process was carried out on a (100)-oriented boron highly-doped p-type Si wafer (resistivity is of 0.01–0.1 Ω cm) in a 16% hydrofluoric (HF) acid solution and ethanol at various current densities. Aluminum was evaporated onto the backside of the Si wafer and then it was annealed at 420 °C in a nitrogen atmosphere for 45 min in order to ensure a good Ohmic contact. The electrochemical process was controlled by a computer program using Galvanostat equipment (Autolab PGSTAT 30) so precise control over the electrical current and the etching time was achieved. Before electrochemical etching, the Si wafer was dipped in a 5% HF acid solution for a minute to remove the native oxide. The electrochemical anodization cell was made of polytetrafluoroethylene (teflon) resin and was designed to have an exposed etching area of approximately 0.79 cm2. After anodization, the sample was washed with 98% ethanol and dried in a primary vacuum. For converting the surface of the silicon nanocrystals from hydrophobic to hydrophilic, we oxidized the as-prepared sample in an ozone atmosphere for 45 min by using an ozone generator (H01 BK Ozone with a capacity of 500 mg h−1). Cross-sectional and top view images of the PSM were obtained using a high resolution field-emission scanning electron microscope (FE-SEM) S-4800. Figure 1 shows the plan-view and cross-section images of the microcavity based on the (HL)3.5LL(HL)3 PS multilayer structure, where the H and L labels correspond to the high and low refractive index layers, respectively, and 3.5 means three and half pairs of HL. We chose a structure with 3 and 3.5 pairs of HL, because this gives a good reflectivity spectrum and an easily repeatable electrochemical etching process [16]. The thicknesses of the high and low refractive layers were 72 nm and 87 nm with accuracy of ±2 nm, respectively. This structure was obtained from an anodization current density of 15 mA cm−2 and 50 mA cm−2 and with an etching time of 5.56 s and 2.86 s for the high and low refractive index layers, respectively. For the measurement of the reflective spectra of the samples, we used an ultraviolet-visible-near infrared (UV-Vis-NIR) spectrophotometer (Varian Cary 5000) and a spectrometer (S-2000, Ocean Optics) with a resolution of 0.1 and 0.4 nm, respectively. The light source was a tungsten halogen lamp (Z 19, Narva). From the experimental results we calculated the refractive indices of 2.1 and 1.75 for the high and low refractive index layers, respectively [16].

Figure 1. (a) SEM plan-view and (b) cross-section images of a PSM design in the (HL)3.5LL(HL)3 structure [16].
Download figure:
Standard image High-resolution imageFigure 2 shows the schematic of the concentration measurement for volatile organics by using a vapor sensor based on a PSM [17]. In this schematic, valve 2 works as a controller of the velocity of the air stream though the flow meter, the test solvent chamber and the sample chamber. Valve 1 is only open to refresh the porous matrix after measurement. The thermostat controls the temperature of the liquid in the range from room temperature to 100 °C [18]. In our experiment, we use an optical fiber splitter BIF200 UV-Vis for light irradiation to the samples and for collecting the reflective spectrum of the microcavity. We have also used a LM35D integrated circuit for measuring the temperature in the sample chamber. It was shown that this temperature was not affected by the solution temperature or by the air rate in our experimental setup. For an experimental data run, it takes 5 min to 7 min depending on the velocity of the airflow. A standard deviation of the wavelength shift from the average value of five experimental data runs is 0.6 nm.
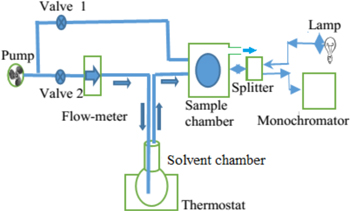
Figure 2. Schematic of the concentration measurement for volatile organics by using a vapor sensor based on the PSM. Valve 1 and valve 2 are used to guide the airflow from a pump into the sample chamber. The arrows indicate the direction of the air or vapor flows [17].
Download figure:
Standard image High-resolution image2.2. Results
2.2.1. Nanoporous silicon microcavity sensor for the detection of organic solvents in gasoline
The basic characteristics of the PSM and the resonant wavelength shift (Δλ) caused by the ambient refractive index (n) were determined experimentally by using a series of liquids with known refractive indices. The effective refractive index of the nanoporous silicon layer immersed into organic solvent would increase due to the substitution of air with liquid in the pores and consequently the optical thickness of the layer increased. In the result, the resonant wavelength shift would be dependent upon the refractive index value of the organic solvent [17].
Sensitivity (Δλ/Δn) is one of the most important parameters to evaluate the performance of the sensors. Using the experimental data in table 1, we calculate the sensor sensitivity of about 200 nm/RIU (related intensity unit). The Spectrophotometer Varian Cary 5000 is able to detect a wavelength shift of 0.1 nm, and then the minimum detectable refractive index change in the PS layer is less than 10−3. Experiment shows that after the complete evaporation of the organic solvent, the reflectance spectra of the sensors return to their original waveform positions (as in the air). In our case the evaporation of organic solvents in open air at room temperature was completed for 40–50 min, but this process can occur for 20 s when the samples were in the vacuum chamber with 10-1 torr. This means that the change of sensor reflectance spectra is temporary and it is useful for reversible optical sensing.
Table 1. Physical properties of acetone and ethanol.
| The coefficients of Antoine's equation | (a)P̣i mmHg | (a)dPi/dT mmHg/°C | ||||||
|---|---|---|---|---|---|---|---|---|
| Solvent | Boiling point (°C) | Refractive index | A | B | C | T = 30 °C | T = 30 °C | T = 50 °C |
| Ethanol | 78.5 | 1.361 | 8.05 | 1554.3 | 222.65 | 78.154 | 480.802 | 1259.4 |
| Acetone | 56.2 | 1.359 | 7.03 | 1161.0 | 224 | 284.187 | 1299.00 | 2596.1 |
Simulation shows that the contrast of the porosities (i.e. the refractive indices) of the layers has a strong influence on the wavelength shift (i.e. on the sensitivity) of the microcavity. The contrast of the porosities would be high when the change of current density was large in the electrochemical etching process. However, experiment shows that the imperfection of the interfaces of layers increased with the large change of current densities. In our work, when the porosity contrast of layers is more than 40, the reflective spectra of the device were deformed in the reflection intensity and the linewidth of the transmittance zone.
The curves from C1 to C4 in figure 3 present the fitting process of sensor basic characteristics by simulation with that by experiment (curve E) [17]. The fitting showed that the porosity contrast between the two layers affects the sensor's sensitivity (Δλ/Δn). Consequently, the matching process found a suitable porosity of 34% and 72% of the low and high porosity layers of the prepared sensor, respectively.
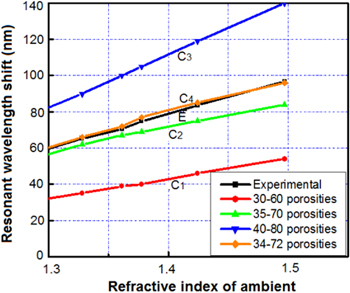
Figure 3. The basic characteristics of the liquid-phase sensor prepared from a PSM obtained in experiment (curve E), and by simulation calculations (curves C1, C2, C3, C4) with various pairs of porosities [17].
Download figure:
Standard image High-resolution imageThe microcavity-based sensors have been applied to determine different solutions of ethanol and methanol in the commercial gasoline A92. Figure 4 shows the measured results of the resonant wavelength shift of the microcavity sensor immersed into gasoline A92 with different concentrations of ethanol and methanol [17]. In the case of a mixture of ethanol/A92, a resonant wavelength shift is of 3.6 nm, when the ethanol concentration changed in the range from 5% to 15% in the gasoline. With the sensitivity of the sensor as described above, the minimum determination of the ethanol concentration change in the gasoline is of about 0.4%. In the case of methanol/A92, the wavelength shifts are of 7.2 nm between the 5% and 15% methanol mixtures, respectively. From this experimental data, we suppose that the elaborated sensor can distinguish change of about 0.2% in a concentration of methanol in the gasoline.

Figure 4. Response characteristics of the sensor wavelength shift for a mixture of methanol and ethanol in different concentrations, and commercial gasoline A92 [17].
Download figure:
Standard image High-resolution image2.2.2. Nanoporous silicon microcavity sensor to simultaneously detect organic solvents
It is known that the response of the sensor depends on the solvent vapor pressure in the sensor chamber [17]. This vapor pressure is related to the vapor pressure of the solvent in the solution chamber through a gas stream flowed through the solution. Assuming that the vapor pressure in the solution chamber obeys the rules of vapor pressure in a closed system, the relation between the wavelength shift (Δλ), the vapor pressure in the solution chamber (Psolution) and the velocity of airflow (V) is crudely presented as  where
where  is an empirical function of V, which shows the dependence of the concentration of solution on the velocity of the airflow. The Psolution can be calculated by following formulas [17]:


where Pi is the vapor pressure of a particular substance, Xi is the corresponding mole fraction of that substance, Ai, Bi and Ci are component-specific constants (the coefficients of Antoine's equation), T is the temperature of the environment and 'i' is an indexing component that keeps track of each substance in the solution.
The equations (1) and (2) show that Δλ is a function of V, Xi and Pi(T). Below we consider those relations in the experiment. We carried out experiments on ethanol and acetone solutions. These are very common organic solvents and some of their physical properties such as their boiling point, refractive indices and Antoine's coefficients from [19] are shown in table 1.
Figure 5 shows the dependence of Δλ on T, Δλ(T), for acetone and ethanol solutions with various concentrations at the airflow velocity of 0.84 ml s−1 [17, 20]. The equations (1) and (2) show that we can consider the temperature dependence of Δλ(T) as the temperature dependence of Pi(T) modified by multipliers Xi if it was assumed that the contribution of water to the solution pressure is small. Experimental data from curve 1, which describes Δλ(T) of the water, shows the validity of this assumption in our measurement. Pi(T) steadily increases as the temperature increases (i.e. a monotonically increasing function), so the curves of the solvent solutions with various concentrations are separate, for example the curves 2–4 of the ethanol solutions or the curves 5–7 of the acetone solutions. Using equation (2) we calculated the rate of change of Pi(T) for acetone and ethanol in the range of temperatures from 30 °C to 50 °C; these values are presented in table 1.
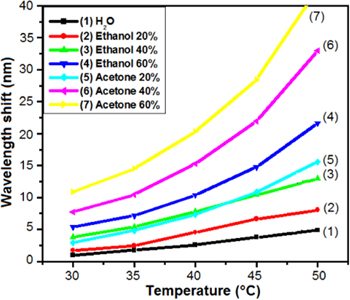
Figure 5. The dependence of the wavelength shift on the solution temperature for pure H2O (curve 1), 20%–60% ethanol (curves 2–4), and 20%–60% acetone (curves 5–7) at V = 0.84 ml s−1 [17].
Download figure:
Standard image High-resolution imageThe slope of Pacetone(T) is greater than that of Pethanol(T) in the studied range of temperature (see table 1), so the curves describing Δλ(T) of acetone and ethanol solutions intersect with each other not more than once (for example: the curves 3 and 5), or do not intersect (for example: the curves 3 and 4). Consequently, a curve describing Δλ(T) characterizes the solution of acetone (or ethanol) at a given concentration. In other words, the dependence of the wavelength shift on the solution temperature discriminates between solutions of ethanol and acetone with various concentrations [20].
Figure 6 shows the dependence of the resonant wavelength shift Δλ(C) on the ethanol concentration, when the velocity of the airflow (V) and the temperature of the solution (T) work as parameters in the measurements [17]. It can be seen in figure 6 that the curve described by Δλ(C) is linear and its slope, i.e. the sensitivity of the measurement, increases as V and T increase. Those remarks are also deduced from equations (1) and (2) when Xi is a variable, and T and V are parameters. The linearity of this dependence is a favorable condition for the determination of the solvent concentration. The increase of the slope creates an increase in sensitivity received from the measurement. From data in the curves 2 and 3, which were received from the measurement with parameters T and V at 45 °C and 0.84 ml s−1, and at 30 °C and 1.68 ml s−1, we obtain the difference of Δλ of about 18.5 nm and 10.0 nm, respectively, between the 0% and 100% ethanol. Whereas having measured with this sensor in the liquid phase in this concentration range, we obtained the Δλ difference of about 5 nm only [20]. Therefore, the sensitivity received from the measurement in the vapor phase with the value of T and V at 45 °C and 0.84 ml s−1, and at 30 °C and 1.68 ml s−1 increases 3.7 and 2.0 times, respectively, as compared with that in the liquid phase. We expect that the sensitivity of the measurement can be strongly improved with a reasonable combination of both parameters T and V.

Figure 6. Dependence of the wavelength shift on ethanol concentrations when the velocity of airflow (V) and the temperature of the solution (T) work as parameters in the measurements [17].
Download figure:
Standard image High-resolution imageFigure 7 shows the dependence of Δλ on V, Δλ(V), at a temperature of 30 °C when the concentration of ethanol and acetone work as the parameters [17]. It can be seen in figure 6 that the curves describing Δλ(V) are separate straight lines with different concentrations of acetone and ethanol. This shows that empirical function ϑ(V) is a linear function of V. Now, we consider the properties of the slopes of curves in figure 8. According to equation (2), the slope of the curve describing Δλ(V) increases as Pi and Xi increase. We apply the obtained results for curves 2 and 3 received from measurements with ethanol and acetone solutions at the same concentration (20%). It can be seen that the vapor pressure of acetone is larger than that of ethanol (see table 2), so the slope of curve 3 is larger than that of curve 2. We also apply those results for curves 2 and 4 received from measurements with ethanol concentrations at 40% and 20%. The slope of curve 4 is larger than that of curve 2 due to the greater value in the concentration.
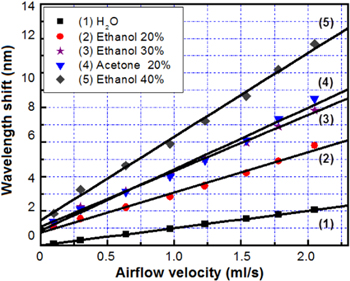
Figure 7. Dependence of the wavelength shift on the airflow velocity in the range 0–2.5 ml s−1 [17].
Download figure:
Standard image High-resolution image
Figure 8. Response curve of the nanoporous silicon microcavity sensor to atrazine.
Download figure:
Standard image High-resolution imageTable 2. Resonant cavity peak shift in the reflectance spectra by the different atrazine concentrations.
| Wavelength shift (nm) | ||
|---|---|---|
| Atrazine concentration (pg ml−1) | Atrazine in water | Atrazine in humic acid (HA) |
| 2.15 | 40.5 | 48.3 |
| 4.3 | 41.6 | 50.1 |
| 8.6 | 43.4 | 55.2 |
| 12.9 | 44.7 | 56.6 |
| 17.2 | 46.3 | 58.9 |
| 21.5 | 47.2 | 60.6 |
It is deduced from figure 7 that the dependence of the wavelength shift on the velocity of the airflow is linear, and the slopes Δλ/ΔV are 2.4 nm ml.s−1 and 3.7 nm ml.s−1 for the same concentration of 20% ethanol and acetone solutions, respectively. In addition, when the concentration of the organic solvent increases, the slopes Δλ/ΔV would be enhanced (for example, the value of Δλ/ΔV enhanced from 2.4 nm ml−1 s to 3.4 and 5.1 nm ml−1 s when the concentration of ethanol increased from 20% to 30% and 40%, respectively). Based on this phenomenon, we can simultaneously determine the kind and concentration of organic content in the solutions. For example, 40% ethanol and 20% acetone have a similar temperature dependence (see figure 5) but can be discriminated by their airflow velocity dependence, and while 30% ethanol and 20% acetone have similar airflow velocity dependence (as can be seen from figure 8), they can be discriminated by their temperature dependence.
2.2.3. Nanoporous silicon microcavity sensor for the detection of pesticide concentration in water
The very low concentration of atrazine solutions was obtained by dilution from a mixture, obtained by stirring 21.5 mg of atrazine in 1000 ml of ultrapure water and a minimum amount of ethanol to ensure solubility (the concentration of atrazine was of about 21.5 ppm or 10−4 M). To determine very low concentrations of atrazine solutions in the range between 2.15 and 2.15 × 10⁶ pg ml−1 (from 10−11 to 10−4 M), we have measured the cavity-resonant wavelength shift of the nanoporous silicon microcavity sensors with various conditions: atrazine in pure water and in an aqueous solution of an HA (0.2 mg ml−1) extracted and purified from soil. HA solutions were chosen to represent systems similar to natural conditions where water-containing pesticides also dissolve organic matter as a component [21]. When an atrazine solution is dropped on to the sensor surface, the solution would partially substitute the air in the pores of each layer of the sensor device causing a change of its refractive index. We observed a repeatable completely reversible change in the cavity reflectivity spectrum.
To test the performance of the optical sensor for the determination of atrazine pesticide, we studied the wavelength shift in the reflectance spectra with various conditions: in air, in pure water and in HA. The effective refractive index of the nano-PSM layer immersed into solutions would be increased due to the substitution of air with liquid in the pores and consequently the optical thickness of the layer is increased. When the microcavity sensor was exposed to water (with a refractive index of 1.3326) and to HA (with a refractive index of 1.3541), the reflectance spectra promptly shifted toward longer wavelengths by about 39.2 nm and 46.5 nm, respectively.
After analyzing the resonant wavelength shift in the reflectance spectra of a microcavity sensor in various conditions, we performed the wavelength shift measurements for the determination of atrazine pesticide in water and HA during their exposure to different concentrations (2.15–2.15 × 10⁶ pg ml−1). It is remarkable that the sensor response depends mainly on two physical factors: the refractive index of the atrazine solution (the concentration of atrzine) and its capability of filling the PS pores. The concentration of atrazine in the solution is determined by the wavelength peak shift of the sensor, and the capability of filling the pores is tested by the repetition of the measurement values. As shown by the experimental results, the resonant peak shift in the reflectance spectra of 1D PSM structures for different atrazine concentrations in water from 2.15 to 2.15 × 10⁶ pg ml−1 is of 21.1 nm, but the sensor responses are nonlinear in a large range of atrazine concentrations. Figure 8 presents the response curve of the sensor to atrazine in water with concentrations from 2.15 to 2.15 × 10⁶ pg ml−1. The wavelength shift is only linearly increased in the very low concentration of atrazine (from 2.15 to 21.5 pg ml−1) in our measurement.
Table 2 presents the measurement results of the resonant wavelength shift of the sensor wetted by atrazine solutions with low pesticide concentrations. The resonant wavelength of the sensor shifted on 6.7 nm and 12.3 nm when the concentration of atrazine changed from 2.15 to 21.5 pg ml−1 in water and in HA, respectively. It is an important factor for sensor applications that the wavelength shift versus the atrazine concentration in a very low range is linear. Figure 9 shows a linear relation between the different concentrations of atrazine in the very low concentration range from 2.15 to 21.5 pg ml−1 and the resonant peak wavelength shift. In the figure 9 [17], each experimental point was the average value of five independent measurements, with the accuracy representing the standard deviation. We could calculate the sensitivity of the sensor as the slope of the linear curve interpolating the experimental points.

Figure 9. Peak shift of the PSM as a function of the atrazine concentration in both water and HA solutions [17].
Download figure:
Standard image High-resolution imageThus, we obtained the sensor sensitivity value of 0.3 and 0.6 nm pg−1.ml−1 for an atrazine aqueous and an HA solution, respectively. From these measurement results, we also estimated the limit of detection (LOD), as the ratio between the instrument resolution and the sensitivity. The LOD numerical value is 1.4 and 0.8 pg ml−1 for atrazine in water and in the HA solution, respectively. In addition, it was observed that the higher wavelength shift was observed in the case of atrazine in HA, because atrazine with HA contains dissolved organic matter as a component having a higher refractive index in comparison with water.
It is remarkable that our sensor has a significant improvement of magnitude of this method for the determination of pesticides present in water in comparison with previous works (for example with [12] and [21]). It may be caused by the different current densities and etching times for the preparation of microcavity samples (i.e. the difference in the porosity ratio of the low and high refractive index layers and the layer thickness) and by the difference of the cavity-resonant wavelengths (visible versus infrared). In our case, the experiment was performed for several measurements and the results have good repetition. On the other hand, the obtained results were checked by a comparison with electrochemical immunoassays [22] using the same method for the preparation of a low-concentration atrazine sample. In addition, it was observed that, after moving the atrazine solution on the sensor surface and washing it with distilled water, the cavity-resonant wavelength in the reflectance spectra promptly returns to its original position. This is a very good quality of these structures, as it is helpful in the development of reversible sensing devices.
3. Compact microcavity light sources based on silica doped erbium
Since a PC microcavity laser was first demonstrated by Painter et al [23], various attractive PC microcavities with different lattices, cavity geometries, and device structures have been widely investigated. With the photonic band gap (PBG) effect, the well-controlled photon flows in PC microcavities hold significant potential for quantum-electron dynamics devices and integrated photonic applications due to their ultrahigh quality factor (Q-factor) and ultralow threshold. As the mirror of the microcavity, a quasiperiodic photonic crystal (QPC) would provide more efficient and uniform in-plane confinement in all directions, which is beneficial to achieve the lasing properties of the lower threshold and the higher Q-factor. Besides, with proper design, WGMs with a high Q-factor can be sustained in a two-dimensional (2D) QPC microcavity, which is confined in-plane by both the PBG effect and the total internal reflection effect [24, 25]. Recently, a new class of microcavity has emerged that is based on plasmons localized to small volumes close to metals. For noble metals particularly, a class of localized electromagnetic modes exists at their interface with a dielectric, called a surface-plasmon polariton. In order to confine optical fields, four implementations are worth notice: flat metals, metallic voids, spherical metals and coupled metal spheres. While plasmons bound to flat metal surface are free to move along the surface, the plasmons on nanostructures can be tightly localized. As in any microcavity, these confined modes can be coupled to other excitations such as excitons in semiconductors, and this has influence on the cavity-resonant wavelength.
In this section we present some experimental results on the development of quantum-electronic devices based on Erbium-doped silica glasses with photonic microcavity configurations assisted by noble metallic layers (Au, Pt, Al) coated on the surfaces. In the first subsection we report a result of controlling the WGM spectrum at a wavelength range of 1550 nm and the upconversion lasing emission at visible light from Er-doped silica glass microsphere lasers. The second subsection shows an upconversion lasing emission from metallic-assisted photonic crystal cavities with ring and/or sphere configurations. The emitted intensity enhancement and wavelength shift of the upconversion emission are obtained in both configurations of microcavities. An atom–photon interaction mechanism and a surface plasmon resonance (SPR) are used for explaining the obtained results. We conclude with some future prospects for the atom–photon interaction in the weak-coupling cavities.
3.1. Lasing modes from Er-doped silica glass microsphere lasers
3.1.1. Fabrication of an Er-doped silica microsphere laser in IMS
The fabrication of Er-doped silica microsphere lasers was presented in our previous work [26]. We formed two kinds of Er-doped silica glass microspheres: for the first kind the homogenous Er-doped glass bulk was used to fabricate the microspheres, and for the other, Er-doped sol-gel silica glass film was used to cover a regular silica microsphere with a thickness of 1.5–2 μm. The Er-concentration of silica glasses was of 1000–4000 ppm and the diameters of the spheres were of 40–150 μm for both kinds of glass microspheres. We used a 976 nm laser diode with an output optical power up to 170 mW in single-mode emission (SDLO-2564-170) for the excitation of the erbium ions. The spectral characteristics of the WGMs were analyzed by the OSA: Advantest Q8384 with a resolution of 0.01 nm.
3.1.2. Control of the WGM spectrum from Er-doped silica glass microsphere lasers
The optical coupling to the spherical microcavity for pumping and for WGMs laser output extraction was performed with two different half-taper optical fibers fabricated by a chemical etching method. The waist diameters of the half-taper were 1 μm and the angle of the taper tip was 0.72°. The coupling gap was adjusted by a system composed of a 3D micro-positioner and a lead-zirconate-titanate (PZT) piezoelectric stack with an accuracy of 10 nm (see figure 10).

Figure 10. Experimental setup for pumping and collecting WGMs from the microsphere laser [27].
Download figure:
Standard image High-resolution imageIn a 1000–4000 ppm Er-doped silica microsphere laser with a diameter of 90 μm we can observe the laser oscillation modes of the microsphere cavity in the large wavelength range from 1510 to 1610 nm. In our experiment, the lasing emission was often a single-mode at threshold and the laser intensity strongly depended upon the Er-concentration in the silica glasses and the diameters of the microspheres [28].
Figure 11(a) shows the quantity of the lasing modes extracted from the 2500 ppm Er-doped silica microsphere laser when the coupling gap was of 2 ± 0.05 μm. We observed the multi-wavelength lasing emission of WGMs with a free spectral range of about 2–3.4 nm; the side mode suppression ratio (SMSR) was of 15–32 dB. When the coupling gap was 0.18–0.60 μm, we often detected a single-mode of WGMs. Figure 11(b) shows a spectrum of the single lasing mode from the existing WGMs in the microspherical cavity, when the coupling gap was adjusted to 0.3 ± 0.05 μm [27]. In addition, the wavelength of the single optical line could be chosen by the precise adjustment of the gap.
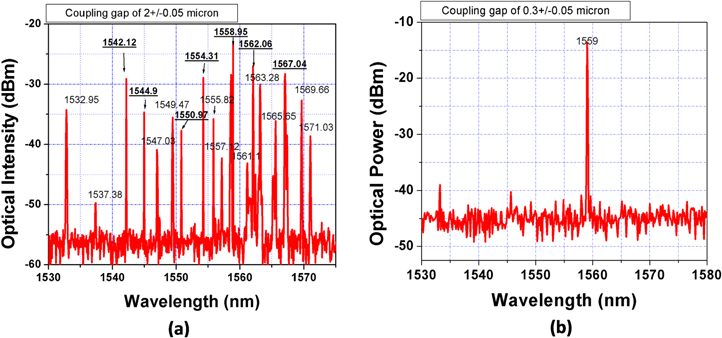
Figure 11. Spectra and quantity of optical WGM lines extracted from an Er-doped silica microcavity laser when the coupling gap between the taper fiber and the sphere surface changed from 2 ± 0.05 μm (a) and to 0.3 ± 0.05 μm (b), respectively [27].
Download figure:
Standard image High-resolution imageFigure 12 presents the single-mode spectra extracted from a 90 μm diameter microsphere laser when the coupling gap was changed from 0.18 μm to 0.6 μm with the accuracy of the coupling gap adjustment being 0.05 μm [27]. When the spacing gap is less than 0.15 μm, the fiber tip begins to vibrate through the effect of dipole-field interaction [29] and the intensity of the collected WGMs gets modulated.
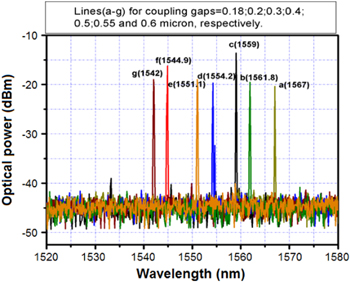
Figure 12. Spectra of single lasing mode extracted from an Er-doped silica microcavity laser when the coupling gap between the taper fiber and the sphere surface was of (a) 0.18 μm, (b) 0.2 μm, (c) 0.3 μm, (d) 0.4 μm, (e) 0.5 μm, (f) 0.55 μm and (g) 0.6 μm, respectively [27].
Download figure:
Standard image High-resolution imageThis technique has a good reproducibility in practice and we can extract most of the WGMs that can oscillate in the microcavity with a suitable adjustment of the coupling gap. Interpretation of the results is not simple, as the oscillating modes depend on various factors: the different evanescent fields of the modes (with their radial and azimuthal dependence) and their coupling with the fiber taper, with resonances when the gain equals the coupling factor [30]. Further work is needed (fiber taper position and angle, polarization) in order to make a full theory regarding mode selection as a function of microsphere data, pump and output taper configuration (see [31]). Figure 13 shows a single optical line amplified by an erbium-doped fiber amplifier (EDFA) with an amplification coefficient of 40 dB [27]. The intensity of a single optical wavelength in this case can reach up to +17.2 dBm, the SMSR is of 40 dB and this selected mode is very stable. This means that the optical lines corresponding to the different WGMs of the microcavity can be easily filtered out, separately modulated, and used as independent optical channels in dense wavelength division multiplexing networks and sensors.

Figure 13. Intensity of +17.2 dBm of a stable single optical line amplified by an EDFA [27].
Download figure:
Standard image High-resolution image3.1.3. Upconversion emission from an Er-doped silica glass microsphere cavity
The upconversion lasing emission at 537 nm, which did not respond to resonant radiative transitions 2 H1 1 /2 → 4I15/2 (at 523 nm) and 4 S 3 /2 → 4I15/2 (547 nm) in erbium ions, from a cavity randomly created by a glass-air gap-polymer cover on the Er-doped silica fibers, was reported in our previous work [32]. The upconversion emission intensity at 537 nm from the random cavity on the fiber is maximal at the perpendicular angle to the fiber axis and its distribution is homogeneously around the fiber.
We proposed that the random cavity on the fiber has a circular form with diameter of fiber. In the case of an Er-doped silica glass microsphere cavity, we have developed a microsphere cavity at the end of Er-doped silica fibers using a thermal melting method. We obtained the same lasing emission in the 537 nm range with a slight wavelength shift (about ± 0.1 nm) in comparison with the circular form cavity, but the emission intensity strongly depended on the measurement direction. Figure 14 presents the schematic setup of the pump and lasing emission measurement from the microsphere cavity. The pump direction is along the fiber and the measurement directions change from orthogonal to parallel to the pump direction.
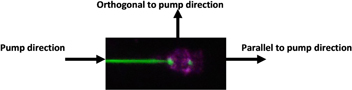
Figure 14. Experimental setup for pumping and measuring the upconversion lasing emission from the microsphere cavity.
Download figure:
Standard image High-resolution imageFigure 15 shows the spectrum and intensity of the lasing emission from the microsphere cavity at a wavelength of 537 nm measured at the orthogonal direction (figure 15(a)) and at the parallel one with respect to the pump direction (figure 15(b)) [33]. The emitted wavelength is the same at 537.196 nm for both cases, but the emission intensity is increased up to 40 times from the orthogonal to the parallel direction of measurement.

Figure 15. Spectra of lasing emission at 537 nm from the microsphere cavity at measuring directions (a) orthogonally angled and (b) parallel to the pump direction. The emission intensity increased from 160 a.u. to 6500 a.u. for the orthogonal and parallel to pump direction, respectively [33].
Download figure:
Standard image High-resolution imageThe dependence of emission intensity from the microsphere cavity on the measurement angle is suitable to the optical sensing technique. Using the model of the coupled photon–atom modes in the cavity [34] we proposed that the 537 nm lasing emission from Er-ions in the fiber can appear by the following method: a diode laser operating at 976 nm pumps the Er-ions from their fundamental level 4I15/2 to 4I11/2 and a second photon transfers the excited ion to another level 4 F 7 /2. This level decays very rapidly to the levels 2 H1 1 /2 and 4 S 3 /2. The splitting of these levels is only some hundreds of cm−1 and the inversion can be achieved between the level 4 S 3 /2 and the upper Stark levels of the ground state 4I15/2 [35]. In our case, the emission at 537 nm does not respond to radiative transition between the excited state 4 S 3 /2 and fundamental state 4I15/2, this means that the emitted photon is a result of the interaction between the resonant cavity photon and the excited ions on the upper levels 2 H1 1 /2 and 4 S 3 /2. The Er-ion population on the state 4 S 3 /2 may be more than on 2 H1 1 /2, and the difference of the resonant photon energy and the radiative energy of transition 4 S 3 /2–4I15/2 is very small in the experiment (it is equal to 42 meV). We can expect that the probability of the photon-excited atom interaction on state 4 S 3 /2 would be more than with the atom on state 2 H1 1 /2 in the cavity.
3.2. Upconversion lasing modes from a metallic-coated microcavity
A metallic-assisted microsphere cavity is created by coating a noble metallic layer on the silica glass hemisphere. In our case we used a vacuum deposition method such as thermal deposition and/or sputtering for coating gold (Au) and platinum (Pt) on the surface of the hemisphere of Er-doped silica glass microspheres, respectively. The thicknesses of the coating of the metallic layers changed from 50 nm to 750 nm. The measurement of the lasing emission used the same method presented in figure 14. Figure 16 shows the spectra and intensities of upconversion emissions from the different configurations of Er-doped silica glasses. The experiment was carried out under the conditions: a silica glass with an Er-ion concentration of 4000 ppm, a diameter of microsphere of 100 μm, an optical pump power at a 980 nm wavelength of 2–40 mW, a measuring angle of 90° to the pump direction. In the case of the glass bulk we obtained a luminescent emission with a large-width spectrum having two peaks at 523.2 nm and 547.2 nm. In the case of the silica glass microsphere for both configurations of the clean silica sphere surface and of the 50 nm thickness Au-coated on the hemisphere surface, the lasing single modes at wavelengths of 537.44 nm and 537.38 nm are observed, but the emission intensity of the Au-coated hemisphere surface is significantly increased in comparison with the pure silica surface. Thus, we conclude that the 50 nm Au layer works as a reflection mirror and it does not exhibit the absorption associated to SPR [36].
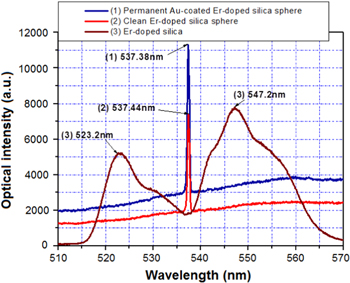
Figure 16. Spectra of the upconversion emission from Er-doped glasses in different surface forms: (1) 50 nm Au-coated hemisphere surface on the microsphere, (2) pure surface of silica microsphere, (3) glass bulk.
Download figure:
Standard image High-resolution imageFigure 17 presents the spectra of green light emitted from different microsphere cavities such as a pure silica surface, a temporal water-coated silica surface, a temporal isopropanol-coated silica surface, and a permanent Au-coated hemisphere silica surface. The emission intensity of the water or isopropanol-coated cavity was decreased, but that of the Au-coated cavity was increased, in comparison with the non-coated cavity. We observed the slight shift of the wavelength peak (0.12 nm) when the silica microsphere was temporally coated by water layers. The Pt layer of 750 nm in the thickness coated on the hemisphere of the Er-doped silica microsphere was developed to study role of metallic film on the operation of the microsphere cavity.

Figure 17. Spectra and intensities of upconversion emission from different surface microsphere cavities: (1) pure surface, (2) temporal water-coated surface, (3) temporal isopropanol-coated surface, (4) permanent Au-coated surface.
Download figure:
Standard image High-resolution imageFigure 18 shows the spectrum and emission intensity in the visible range from an Er-doped microsphere cavity with a 750 nm thickness Pt layer coated on the hemisphere [33]. The pump optical power at 980 nm is of 2 mW and the measurement angle is perpendicular to the pump direction. We remark that the emission intensity of this case is very strongly increased (by 10–20 times) and the emitted wavelength is slightly decreased in comparison with other studied microcavities (on 0.36 nm in comparison with a non-coated cavity). The emitted intensity distribution versus the measuring angle from the metallic-coated sphere cavity is shown in figure 19 [33]. An emission distribution by angle to pump direction coincides with Gaussian law. It is remarkable that the surface plasmon coupled emission (SPCE) on the Pt-film had a resonant wavelength in the range of 520–570 nm [37] and the strong intensity increase and wavelength shift of the green light emission from the hemispherical Pt-coated cavity may be caused by metal-enhanced fluorescence (MEF).

Figure 18. Spectrum of the upconversion emission from Pt coated on the hemisphere of the silica microsphere cavity. The Pt-film thickness is 750 nm, the optical pump power at 980 nm wavelength is 2 mW, and the measuring angle is orthogonal to the pump direction [33].
Download figure:
Standard image High-resolution image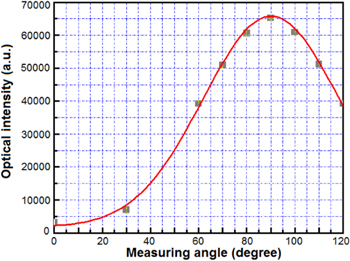
Figure 19. Emitted intensity distribution versus measuring angle to pump direction for the Pt-coated microsphere cavity. The optical pump power at 980 nm wavelength is 3.5 mW [33].
Download figure:
Standard image High-resolution imageThe Al-coated silica microsphere was made by a thermal vacuum deposition of pure Al-metal with an Al-layer thickness of 200 nm. The lasing threshold of the 537 nm emission is obtained at 60 nW of pump power. Figure 20 shows the emission spectrum from the Al-coated silica microsphere pumped by a 976 nm laser diode of 60–80 nW. The narrow lasing line at the 537 nm wavelength appeared on the large spectral noise.

Figure 20. Spectral lasing intensity of the 537 nm emission from the Al-coated silica microsphere at 976 nm pump power of (a) 60 nW and (b) 80 nW.
Download figure:
Standard image High-resolution imageFigure 21 presents the characteristic of lasing intensity versus pump power for Au, Pt and Al-coated microspheres with the same diameter of 100 μm. The lasing threshold of the Al-coated microsphere was decreased ten or a hundred times in comparison with the Pt and Au-coated spheres.

Figure 21. Characteristics of lasing intensity versus pump power of Al, Au and Pt-coated silica microspheres.
Download figure:
Standard image High-resolution imageAccording to the results presented above, we see that the 50 nm Au layer works as a hemisphere-form mirror supporting the reflection and collection of light emitted by Er-ions in the silica glass, but the Pt and Al-coated layers simultaneously play the role of reflectors and enhancers of light by the SPCE effect. Interpretation of the results is not simple, as the surface plasmonic resonant frequencies depend on various factors: the different materials and their sizes, the configurations of metal surfaces and the distributions of optical fields [38–40]. Further work is needed (emission enhancement by surface plasmonic resonance, thermal effect on upconversion emission) in order to make a full theory about the abnormal lasing emission at 537 nm from Er-ions in a weak-confining cavity as a function of the microsphere data and pump.
4. Optical filter based on guided-mode resonances in coupled slab waveguide gratings
Guided-mode resonances (GMRs), well-known as the resonant coupling of external radiation to leaky modes of slab waveguide gratings or 2D PCs, have been studied [41, 42]. GMRs have found application in the design of light-emitting diodes [43], lasers [44], biosensors [45], filters [46], and optical switches [47–52]. Among all the proposed structures for optical filters, slab waveguide gratings based GMRs are promising designs due to their simple structures with easy in/out coupling and their cost-efficient fabrication process. They have been demonstrated in theory, simulation, and experiments.
When two slab waveguide gratings interact with each other, the resonant characteristics of the system can be tuned. The interaction between two slab waveguide gratings occurs in two possible routes: one is a direct coupling and the other is an indirect coupling through free-space propagation. Depending on the relative couplings, differently resonant characteristics are observed. The tunability of optical filters based on GMRs in coupled two slab waveguide gratings has also been studied [46, 49–51]. Tunable optical filters based on the relative couplings of two slab waveguide gratings may have advantages due to their economic wide area fabrication. Besides the relatively simple band structures of the two slab waveguide gratings will allow conceptually easier control of physical parameters and straightforward design.
In this section we present the general characteristics of coupled two slab waveguide gratings by using the temporal coupled-mode theory, and based on that, the characteristics and tunability of GMR in coupled two slab waveguide gratings are discussed. The tunability of the GMR in coupled gratings is numerically demonstrated by using the finite-difference time-domain method, which reveals that both strong and weak coupling regimes can be adopted to realize wide-range wavelength tunable optical filters in good agreement with the coupled-mode theory analysis.
4.1. Theory
Figure 22(a) depicts the coupled slab waveguide grating structure.

Figure 22. (a) Coupling of two slab waveguide gratings, (b) coupling of two resonators which is equivalent to (a).
Download figure:
Standard image High-resolution imageA leaky mode is excited by normally incident light, and due to the leaky nature the excited guided-mode radiates outgoing waves as it propagates through the slab waveguide grating. The GMR in a lossless single grating gives about 100% reflection at the resonance [46, 48–51]. At the near-resonant frequencies, the characteristics can be modeled as the resonators that are side-coupled to a wave propagating channel (waveguide) with physical parameters such as resonant frequencies ω1, ω2 and decay rates 1/τ1, 1/τ2 of the resonators. The equivalent to the coupled gratings is depicted as figure 22(b). The temporal change of the normalized mode amplitudes of the resonators, a1 and a2 are described by [53]
where μ and θ are the coupling strength and phase retardation between two resonators; sin, sr, st are the amplitudes of the incoming, reflected, and transmitted waves; a1 and a2 are the complex mode amplitudes of the resonators; |a|2 and |s|2 refer to the energy stored in the resonator and the power of the wave, respectively. The reflection is given by:
Figure 23(a) shows the calculated reflection of coupled two identical resonators (ω1 = ω2 = ω, τ1 = τ2 = τ) as a function of a normalized frequency, (ω − ω0)τ/2 = Δωτ/2 for different values of μτ with θ = π/2. As μ increases, the separation between two symmetric resonant peaks increases. Figures 23(b) and (c) show the calculated reflection for different values of θ with μτ = 20 and 0, respectively. We can see that if the coupling strength between the resonators is strong (μτ = 20), the phase retardation θ does not change the resonant peaks much but mainly affects the linewidths of the peaks; the first peak gets sharper and the second peak gets broader. This characteristic provides a means to control the linewidth (Q-factor) and the resonant frequency, which may find many applications. In figure 23(c), when two resonators are separated far enough (μ = 0), the phase retardation θ plays an important role in tuning. In this case, the reflected dip disappears for θ = 0. We can obtain a tunable resonant transmission and the tuning range is determined by the decay rate (1/τ) of the resonator. The explanation was discussed [46, 49–51]. For the case of two different resonators (ω1 ≠ ω2, τ1 ≠ τ2), two resonant peaks are always separated for both cases of weak and strong couplings between two resonators (figure 23(d)).

Figure 23. Calculated reflection spectra: (a) coupled two identical resonators for different values of μ with θ = π/2; coupled two identical resonators for different values of θ with (b) μτ = 20 and (c) μτ = 0 (c); (d) coupled two different resonators (ω1 ≠ ω2, τ1 ≠ τ2) in both strong and weak couplings with θ = π/2.
Download figure:
Standard image High-resolution image4.2. Design and numerical calculations
Based on the theory presented above, we design GMRs in coupled gratings in regimes of strong and weak couplings. Figure 24(a) shows a coupled grating whose guiding layer is chalcogenide glass (As2S3, n = 2.38) with a thickness of 350 nm. The grating is formed by rectangular corrugation, with a period (Λ) and filling factor of 800 nm and 0.5, respectively. The glass substrate (n = 1.5) is assumed to be thick enough with a nonreflecting bottom. The parameters of the resonator (ω and τ) of each grating can be designed by changing the grating depth (δ). In the calculation, a transverse-electric (TE) polarized normally incident wave is assumed. A perfectly matched absorbing boundary condition is used for the top and the bottom sides [54]. In the lateral direction, a periodic boundary condition is applied.
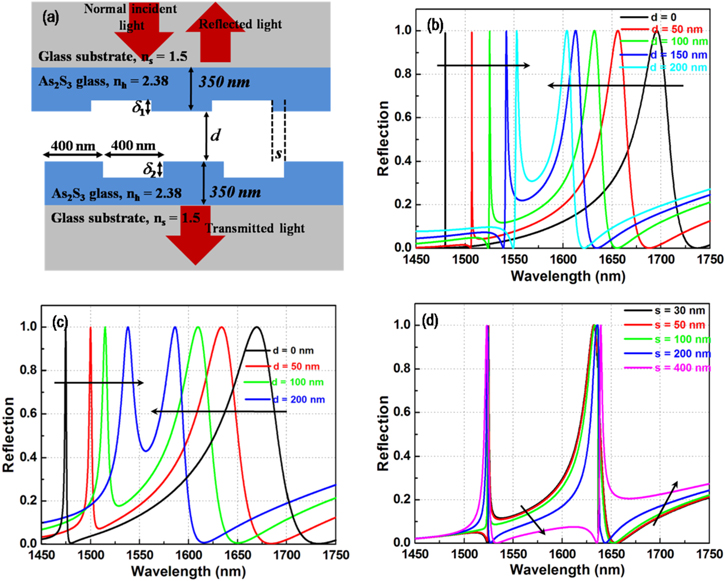
Figure 24. (a) Structure of coupled grating system. (b) and (c) numerical reflection spectra of coupled two identical gratings (δ1 = δ2 = 50 nm) and two different gratings (δ1 = 50 nm, δ2 = 90 nm) for several air gap distances d and perfect alignment of two gratings, respectively; d) reflection spectrum of coupled two identical gratings with air gap distance d of 100 nm for several lateral alignment s.
Download figure:
Standard image High-resolution image4.2.1. GMR system in a strong coupling regime
Figures 24(b) and (c) show the numerical reflection spectra of the coupled two identical gratings (δ1 = δ2 = 50 nm) and two different gratings (δ1 = 50 nm, δ2 = 90 nm) for several air gap distances d and the perfect alignment (s = 0) of two gratings, respectively. The same tendencies of the resonant peaks and linewidths are observed in both cases. Figure 24(d) shows the reflection spectrum of coupled two identical gratings with the air gap d of 100 nm for several lateral alignments s. Note that the quarter and half period shifted alignments are s = 200 nm and 400 nm. The lateral alignment is supported to mainly change the phase retardation with the coupling strength remaining almost the same. A lateral alignment shift over a half period may cause a θ change of π roughly.
4.2.2. GMR system in a weak coupling regime
As mentioned in the theory outlined above, a resonator with a low Q-factor is preferred for a wide tuning range in a weak coupling regime. A GMR grating with a wideband reflection spectrum that has been considered in other works [46, 49–51] is used to investigate the tuning of the resonant transmission.
Figures 25(a) and (b) show that the reflection in couples of two identical and two different gratings for air gap distances d varied from 1000 nm to 2500 nm, respectively. It has been confirmed by the weak coupling between the two gratings. The calculated spectra are independent of the lateral alignment of the two gratings since free-space propagation is a dominant coupling mechanism.

Figure 25. Reflection spectra in couples of two identical and two different gratings for air gap distances d varied from (a) 1000 nm to (b) 2500 nm.
Download figure:
Standard image High-resolution image
5. Conclusions
In conclusion, we successfully constructed a high sensitivity measurement system for the determination of solvent solutions and pesticide concentrations in water by using an optical sensor based on a nanoporous silicon microcavity. An elaborated sensor sensitivity of 200 nm/RIU can detect a minimum refractive index change of about 10−3. We used these sensors for the determination of ethanol and methanol concentrations from 5% to 15% in the commercial gasoline A92. For a simultaneous detection of different organic solvents, the sensor response is controlled by the temperature of the solution and the velocity of the air stream flowing though the solution. The nanoporous silicon microcavity sensor is capable of determining the atrazine pesticide with concentrations in the range from 2.15 to 21.5 pg ml−1 with an LOD of about 1.4 and 0.8 pg ml−1 for the environment of water and HA, respectively; this makes it practically useful to measure values less than the maximum allowed concentrations in water for human consumption.
We have demonstrated the results of the fabrication of compact light sources based on a silica microsphere cavity. The control of emitted WGMs from microsphere cavity lasers is an important condition for their applications. The lasing emission at a wavelength of 537 nm from Er-ions doped into silica glasses, which does not respond to any radiative transitions of the erbium ions, in the weak-coupling cavity is interesting for fundamental investigations and applications. The metallic-assisted microsphere cavities with emission intensity increase by reflection as the mirror and enhancement of light by the SPCE effect open the new research direction of combining the surface plasmonic effect and the microcavity for new photonic devices. The dependence of the collected emission intensity on the measuring angle from devices shows a significant potential for optical sensor applications.
For designing micro and nanosize photonic devices, we presented a general theory on optical filters in coupled resonators using the coupled-mode theory in time and used it for the new optical filter. Two main parameters affecting the resonant reflection characteristics are the coupling strength and the phase retardation between the two gratings. The coupled-mode theory analysis is confirmed by a numerical study of the optical filters based on coupled gratings using the finite-difference time-domain method. The independent controllability of the resonant wavelength and the linewidth in a strong coupling regime is expected to find applications in many optical devices.
Acknowledgments
This work was financially supported by the Vietnam Academy of Science and Technology and the Institute of Materials Science under different research projects. The authors gratefully acknowledge Nguyen Van Hieu for his useful discussion and encouragement.