

Abstract
Phase separation of binary blends composed of a polystyrene derivative (PS) and poly (vinyl methyl ether) (PVME) with a lower critical solution temperature (LCST) was experimentally induced by two different methods: heating and UV light irradiation. Using laser light scattering combined with the temperature jump (T-jump) technique, it was demonstrated that in the case of heating, the mixture undergoes phase separation via the nucleation-and-growth (NG) and the spinodal decomposition (SN) processes under shallow and deep quenches, respectively. Particularly, the crossover from the spinodal decomposition to the nucleation-and-growth process was observed at long time under a deep T-jump by light-scattering experiments. On the other hand, in the photo-crosslink case, the PS/PVME blends undergo a nucleation-and-growth process upon irradiation with weak light intensity, whereas the mixture exhibits the spinodal decomposition under irradiation with strong light intensity. From the analysis of the light-scattering data obtained for the blends under the photo-crosslink, the kinetic data reveal the suppression of morphologies having large characteristic length scales. This feature clearly differs from the phase separation induced by heating where no mode-suppression process was observed. It was also found that distribution of the characteristic length scales (the regularity) of the morphology becomes narrow as the phase separation proceeds for reacting blends, whereas it becomes broader as the phase separation proceeds by heating, revealing the important roles of reaction in the suppression of fluctuations with long wavelengths. These experimental results establish a method to control the length scales and the regularity of the morphology of polymer blends by chemical reaction.
Export citation and abstract BibTeX RIS

Original content from this work may be used under the terms of the Creative Commons Attribution 3.0 licence. Any further distribution of this work must maintain attribution to the author(s) and the title of the work, journal citation and DOI.
1. Introduction
For most cases, polymer materials in current use are composed of multi-components because one single polymer component cannot satisfy all the demands of materials usage. Multicomponent polymer materials, the so-called polymer alloys, have been studied and developed from these demands [1, 2]. Since polymers are often mutually immiscible and consequently undergo phase separation, the physical properties (mechanical, electrical, optical etc) of phase-separated polymer mixtures strongly depend on their morphologies. In the past few decades, morphology control has been one of the central subjects of polymer materials science and engineering. These intensive studies have revealed the practical importance of polymer mixtures with the co-continuous morphology [3]. Since then, a large number of experimental methods have been proposed to construct polymers bearing bi-continuous morphologies. For polymeric systems, polymers with periodic bi-continuous or tri-continuous morphologies have a high potential for fabrication of materials for controlling the molecular transport processes such as in gel permeation chromatography (GPC) [4], polymers with superior mechanical properties [5], in solar cell research [6], electric conductivity [7], ion transport [8] and so on. As a consequence, a large amount of research in polymers in the last few decades has been focused on control and design of co-continuous structures.
It is well known that there are two distinct mechanisms for the liquid–liquid phase separation. One is the spinodal decomposition and the other is the nucleation-and-growth mechanism. As illustrated in figure 1, the former occurs inside the unstable region of the liquid–liquid mixture, where the co-continuous structures are formed and grow with time. On the other hand, the nucleation-and-growth process takes place inside the metastable region of the mixture and is terminated with random droplet structures.

Figure 1. Phase diagram and the corresponding Gibbs free energy curve of a binary mixture with a lower critical solution temperature (LCST).
Download figure:
Standard image High-resolution imageIn this paper we show that unlike non-reactive mixtures, reactive polymer blends with highly asymmetric composition can lead to the formation of various bi-continuous morphologies by polymerization. Furthermore, polymerization can serve as a selector of concentration fluctuations induced by the reaction inside the mixture. As a result, polymer materials with various bi-continuous structures in the micro- and sub-micrometer scales can be controlled and designed. The kinetics process of the phase separation was observed by light scattering and analyzed to compare with current theories. These experimental results could provide a useful strategy for designing polymer materials with co-continuous morphologies in the micrometer scales. Finally, the significant contributions of polymerization in suppression of the development of the long-wavelength structures will be discussed.
2. Experimental
2.1. Materials
Samples used in this study are poly(vinyl methyl ether) (PVME, Aldrich) (Mw = 9.0 × 10⁴, Mw/Mn = 2.3) and polystyrene doubly labeled with fluorescein and anthracene (PSAF, Mw = 2.1 × 10⁴, Mw/Mn = 2.0). Here, fluorescein and anthracene were used respectively as a fluorescent marker for morphological observation by optical microscopy and as a photo-crosslinker upon irradiation with UV (365 nm) light. All the polymers were purified by using appropriate solvent/non-solvent pairs to remove impurities and unreacted low molecular weight components used in the process of chemical synthesis. The details of sample synthesis are described elsewhere [9].
2.2. Sample preparation
PSAF/PVME films were prepared by the solvent casting method. The toluene solutions containing a fixed amount of the two polymers were stirred at room temperature for 2 h. Subsequently, the uniform solution was filtered through a Teflon filter with the pore size 0.2 μm. The filtered solution was casted on Pyr x glass and dried at 65 °C overnight in vacuo. Subsequently, the blend was sandwiched between two Pyrex cover glasses with a 10 μm aluminum spacer used to adjust the sample thickness and finally the sample was kept under vacuum at 65 °C for another night prior to the light-scattering experiments.
2.3. Apparatus
2.3.1. UV–Vis spectrometer
The yield of the crosslink reaction among the PSAF component was in situ monitored by using a UV–Vis spectrophotometer (Shimadzu, Model UV-1600). The crosslink density γ in terms of the number of crosslink junctions per chain was calculated from the variation of the absorbance OD of anthracene with irradiation time:

where α is the average number of anthracene labeled per PSAF chain, OD(0) and OD(tirr) are respectively the absorbance of anthracene measured at 365 nm before and after tirr min of irradiation. The integer 2 in the denominator of equation (1) indicates that two anthracene molecules undergo photodimerization and form a linkage between two corresponding segments of PSAF chains in the mixture under irradiation.
2.3.2. Laser light-scattering apparatus
Light-scattering intensity distribution from a PSAF/PVME mixture was in situ measured during irradiation using a laser light-scattering photometer (DYNA-3000, Otsuka Electronics Inc., Japan) equipped with a high-pressure Hg–Xe lamp (250 W cm−2). The temperature was regulated with a precision of  using a digital temperature controller. The corrections of scattering angle for the change in refractive index of the crosslinked sample and for the effects of cloudiness on the scattering intensity were carried out as previously reported [10]. Other details for the data analysis were described in previous publications [11].
3. Results and discussion
3.1. Phase boundary of PSAF/PVME blends
The boundary between the one-phase and two-phase regions of the PSAF/PVME blend was determined by the cloud point measurements. At first, a PSAF/PVME blend was annealed at 90 °C in the one-phase region for 60 min prior to being heated at a constant rate of 0.2 °C min−1 while the scattering intensity was simultaneously monitored under the light-scattering photometer at a fixed angle. As illustrated in figure 2, upon increasing the temperature at a constant heating rate, the scattering intensity gradually increases and exhibits a sudden change at a particular temperature which corresponds to the boundary between the one and two-phase regions of the mixture. By measuring the cloud points of the PSAF/PVME blend with different compositions by light scattering, the phase diagram was constructed and is shown in figure 3. It was confirmed that PSAF/PVME blends possess a lower critical solution temperature (LCST) similar to the non-labeled PS/PVME mixtures. The results are consistent with those obtained by small-angle neutron-scattering (SANS) reported previously with deuterated polystyrene/poly(vinyl methyl ether) mixtures [12]. It was found that the critical composition is located in the vicinity of PSAF/PVME  and (15/85). Thereafter, we utilize these two particular compositions to carry out the experiments.

Figure 2. Determination of the cloud point of a PSAF/PVME mixture. The temperature at which the scattering intensity suddenly increases corresponds to the cloud point of the mixture.
Download figure:
Standard image High-resolution image
Figure 3. The cloud point curve of a PSAF/PVME mixture determined by light scattering under a heating rate of 0.2 °C min−1. The critical composition is located between the two compositions indicated by the dotted line.
Download figure:
Standard image High-resolution image3.2. Photo-crosslink kinetics of PSAF/PVME blends
Upon irradiation with 365 nm, anthracene moieties labeled on the PSAF component in a PSAF/PVME (10/90) undergo photodimerization, forming bridges among the PSAF chains. As the reaction yield reaches a critical threshold, phase separation takes place. The crosslink kinetics at 94 °C in the one-phase region of the blend was monitored by following the changes in the absorbance of anthracene at 365 nm. Illustrated in figure 4(a) is the change in the normalized absorbance (OD) of anthracene monitored by using a UV–Vis photospectrometer under different irradiation intensities ranging from 0.01 ∼ 0.1 mW cm−2. Because the crosslinked blend turns cloudy upon phase separation, which interferes with the absorption measurements, the change in OD of the anthracene can only be measured up to a certain irradiation time. From equation (1), the corresponding crosslink density was calculated and shown in figure 4(b). It was found that as irradiation intensity increases, the crosslink density increases. It should be noted that due to the interference of the cloudiness of the sample upon irradiation, the OD data were truncated at the point where the phase separation takes place. These results could provide information for morphology control using photo-crosslink reactions.

Figure 4. (a) Dependence of the normalized optical density of anthracene on irradiation time. The absorption data were truncated by the interference of phase separation. (b) Evolution of the crosslink density with irradiation time calculated from equation (1) for the four irradiation intensities indicated in the figure.
Download figure:
Standard image High-resolution image3.3. Kinetics of phase separation induced by a temperature jump (T-jump)
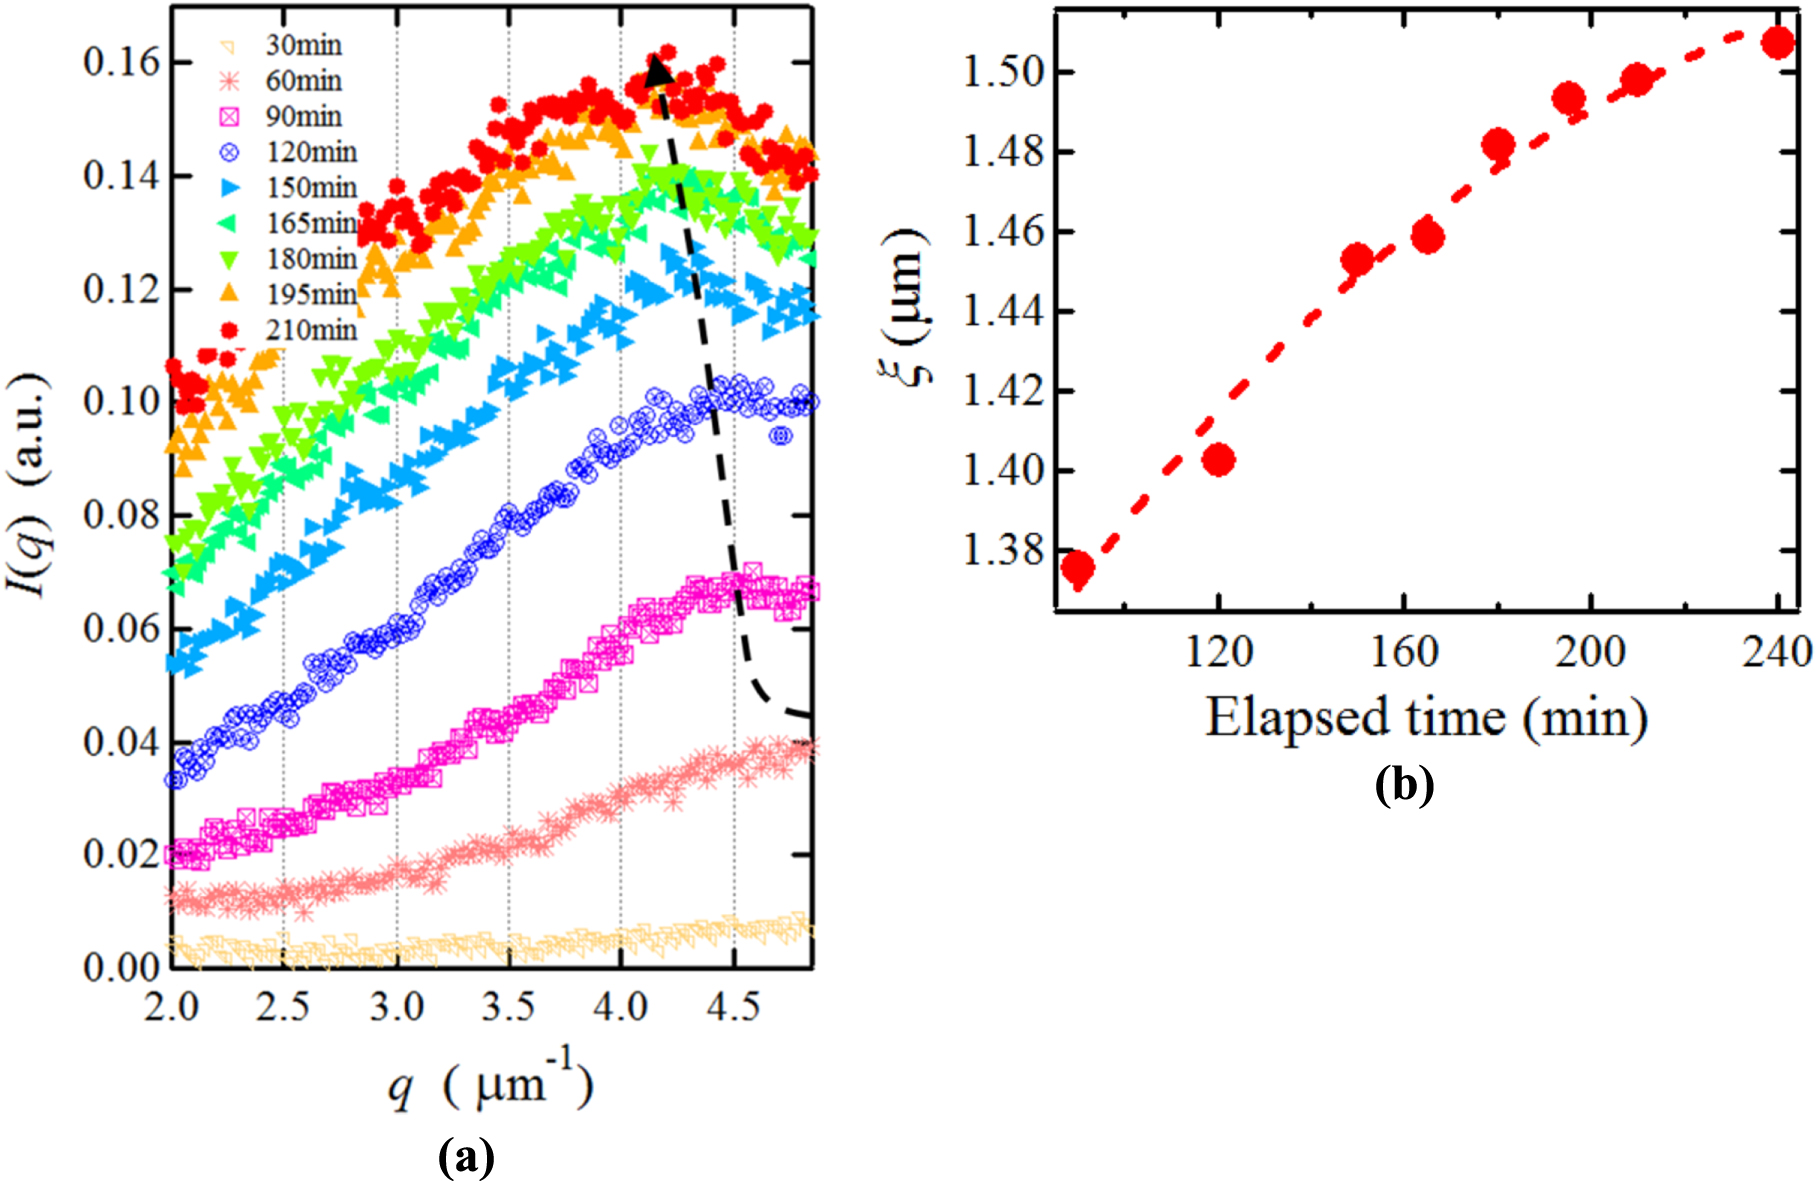
Phase separation of a PSAF/PVME (15/85) mixture was thermally induced by a temperature jump (T-jump) from 94 °C, i.e. 1 °C below the cloud point inside the one-phase region, to 96 °C in the two-phase region. The light-scattering profile of the blend was in situ monitored after the T-jump process. Shown in figure 5(a) are the light-scattering profiles observed for the blend after this T-jump. The broad peak of the scattering intensity distribution appears after 30 min of the T-jump and gradually moves towards the side of low scattering vector q (i.e. small scattering angle) where q is given by  Z. Here, λ, n and θ are respectively the incident wavelength, the refractive index of the sample and the scattering angle. From the peak position shown in the figure, the characteristic length scale of the bi-continuous structures was calculated and the results are illustrated in figure 5(b).

Figure 5. (a) Time evolution of the scattering intensity observed for a PSAF/PVME (15/85) mixture subjected to a T-jump from 94 °C to 96 °C. (b) Evolution of the characteristic length scales with elapsed time obtained from (a).
Download figure:
Standard image High-resolution imageIt was found that ξ increases with increasing elapsed time and evolves with time in a much slower fashion compared to the (1/3) Lifshitz–Slyosov–Wagner power law [13, 14]. On the other hand, under the same T-jump conditions, a PSAF/PVME (10/90) mixture exhibits a completely different scattering behavior. As illustrated in figure 6(a), the scattering intensity distribution of a PSAF/PVME (10/80) blend does not show any scattering maximum (peak) like in figure 5(a) for the case of a PSAF/PVME (10/90) mixture under irradiation, suggesting that phase separation induced by this T-jump condition might result from a different mechanism. To experimentally confirm this speculation, the Guinier plot [15] expressed by equation (2) was performed using the scattering data obtained from figure 5(a).

here I(q) is the scattering intensity obtained at the wavenumber q and I(0) is the scattering intensity at θ = 0°,  is the radius of gyration of the structures involved in the scattering process. In figure 6(b), the logarithm of the scattering intensity, ln I(q), was plotted versus the wavenumber q. It was found that the linear relationship between ln I(q) and q was held over a wide range of the wavenumber q. The arrow associated with each straight line indicates the position satisfying the condition
  where
where  and q are respectively the radius of gyration of the structure and the magnitude of the scattering vector. From the data shown in figure 6(b),
  was calculated using equation (2) and its time evolution is illustrated in figure 6(c). It was found that during the phase separation process, the radius of gyration
  increases with time and its time evolution is faster than the prediction by the 1/3 power law of the Ostwald ripening. The elapsed-time dependence of the radius of gyration
  is illustrated in figure 6(c).

Figure 6. (a) Time-evolution of the scattering intensity observed for a PSAF/PVME (10/90) mixture submitted to a T-jump from 94 °C to 96 °C. (b) Guinier plot of the data shown in (a). (c) Evolution of the radius of gyration Rg with elapsed time after the T-jump.
Download figure:
Standard image High-resolution image3.4. Crossover from the unstable to the metastable regions in thermally induced phase separation
For a PSAF/PVME (10/90) mixture submitted to a deeper T-jump from 94 °C (in the one-phase region) to 98 °C (in the two-phase region) corresponding to a jump depth ΔT = 3 °C, peculiar behavior of the scattering intensity was observed as illustrated in figure 7(a). For the first 300 min, the reacting mixture remains in the spinodal region as evidenced by the emergence of a broad peak which appears after ca. 45 min of the T-jump and develops with time while moving towards the side of the low angle (small wavenumber q). However, after 300 min, the broad peak becomes almost invisible whereas the scattering intensity in the low-q range becomes stronger with elapsed time, taking over the contribution of the spinodal decomposition process to the scattering intensity distribution. The characteristic length scale calculated from the scattering maximum in figure 7(a) using the Bragg condition is depicted in figure 7(b). The result indicates that the growth of the spinodal decomposition was stopped by this crossover process of the phase separation.

Figure 7. (a) Spinodal nucleation crossover observed for a PSAF/PVME (10/90) mixture under a T-jump from 94 °C to 98 °C. The number in the figure indicates the elapsed time after the T-jump. (b) Evolution of the characteristic length scale of bi-continuous morphology during the spinodal nucleation crossover.
Download figure:
Standard image High-resolution image3.5. Phase separation induced by photo-crosslink of the PSAF component
Instead of using heat to induce phase separation, photo-crosslink reaction of the PSAF component was utilized to destabilize a PSAF/PVME (10/90) mixture by utilizing photodimerization of anthracene moieties labeled on the PSAF chains. For this purpose, a PSAF/PVME (10/90) mixture was irradiated in the one-phase region at 94 °C using 365 nm UV light with the intensity 0.01 mW cm−2. As shown in figure 8(a), the phase separation takes place after 30 min of irradiation and continues as irradiation time increases. The scattering peak moves toward the small scattering angle while the intensity increases with irradiation time. As usual, the characteristic length scale ξ was calculated from the Bragg condition and its evolution with irradiation time is illustrated in figure 8(b). It seems that the length scale of the spinodal decomposition tends to approach a constant characteristic length scale at long irradiation time. To clarify the suppression of the phase separation by photo-crosslinking reaction, higher UV light intensity was used in subsequent experiments as described below.

Figure 8. (a) Time evolution of the scattering intensity observed for a PSAF/PVME (10/90) mixture photo-crosslinked by 365 nm UV light with I = 0.01 mW cm−2 at 94 °C. (b) Dependence of the characteristic length scale on the phase separation time obtained from the scattering data shown in (a).
Download figure:
Standard image High-resolution imageThree different light intensities 0.03, 0.05 and 0.10 mW cm−2 were used to induce the phase separation of PSAF/PVME (10/90) mixtures. Shown in figure 9(a) is the scattering profile obtained from a PSAF/PVME (10/90) mixture under irradiation with 365 nm UV light at 94 °C in the one-phase region. It was found that after 10 min of irradiation with I = 0.03 mW cm−2, the broad peak of the scattering intensity appears and gradually develops with irradiation time. Unlike the case of phase separation induced by heating, the peak of the scattering profile obtained for the photo-crosslinked blends is gradually sharpened with increasing irradiation time, suggesting that the characteristic length scales of the periodic structures was narrowed by some mode selection process driven by the crosslink reactions. The development of these periodic structures with irradiation time is illustrated in figure 9(b) where the characteristic length scales of these continuous structures are plotted versus the phase separation time defined as (tirr—to), i.e. the net time of the phase separation process. Here to is the onset time of phase separation determined from the sudden increase of the scattering intensity from the sample under irradiation as shown in figure 2 above. The behavior of the characteristic length scale ξ of the co-continuous structures induced by the photo-crosslink reaction is shown in figure 9(b). The result suggests that the phase separation is first promoted until (tirr—to) ∼ 100 min, and then the structure was frozen as revealed by a constant value of ξ at longer irradiation time. It should be noted that the kinetics of phase separation is slower than the 1/3 power law mentioned above. It was found that upon increasing the light intensity from 0.03 to 0.10 mW cm−2, the growth of the bi-continuous structures generated by the phase separation becomes more limited and is clearly suppressed by the polymerization. The effects of photo-polymerization on the phase separation kinetics observed under various light intensities ranging from 0.01 to 0.10 mW cm−2 are summarized in figure 10 where the normalized characteristic length scale ξ(t)/ξ0 is plotted versus the time of phase separation defined as (tirr—to). Here, ξ0 is the characteristic length scale of the spinodal structure calculated from the broad peak which appears at the beginning of the phase separation, i.e. the irradiation time t0. It is worth noting that the irradiation time t0 is gradually shorter as the irradiation intensity increases, with t0 = 40, 18, 12 and 9 min corresponding respectively to I = 0.01, 0.03, 0.05 and 0.10 mW cm−2. It was found that there is a general tendency for the phase separation induced by the crosslink reaction. For the case of deep quench which corresponds to the high irradiation intensity, phase separation took place via the spinodal decomposition process, starting with the scattering intensity distribution having a broad peak. As irradiation time increases, the scattering peak becomes stronger and sharper, while the phase separation is gradually suppressed as revealed by the saturation of the characteristic length scales ξ with the phase-separation time (tirr—t0), particularly in the case of I = 0.10 mW cm−2. This behavior of phase separation kinetics can be explained as due to the suppression of the fluctuations of long wavelengths induced by the photo-crosslink reactions. Similar results were previously reported by using phase-contrast optical microscopy [16, 17]. Eventually, the phase separation was stopped just after the photo-crosslinked mixture enters the spinodal region. These experiments indicate that the light intensity can be used as a control parameter for the morphology resulting from photo-crosslinked blends and also suggest a method to design a polymer with various bi-continuous structures.

Figure 9. (a) Time evolution of the scattering intensity profile of a PSAF/PVME (10/90) mixture observed upon irradiation with UV light of intensity I = 0.03 mW cm−2; the number in the figure indicates the irradiation time. (b) Evolution of the characteristic length scales of the co-continuous structures obtained from (a).
Download figure:
Standard image High-resolution image
Figure 10. Dependence of the normalized characteristic length scales on the irradiation intensity obtained for a PSAF/PVME (10/90) by light scattering at 94 °C.
Download figure:
Standard image High-resolution image3.6. Mode selection process observed by light scattering for photo-crosslinked blends
In order to understand the mode selection process in photo-crosslinked blends, the scattering intensity distribution I(q) obtained under different irradiation times tirr was normalized by dividing I(q) by the scattering peak intensity I(qmax), and the wavenumber q by the peak position qmax. Shown in figure 11(a) is the plot of the normalized scattering intensity distribution [I(q)/I(qmax)] versus (q/qmax) obtained for a PSAF/PVME (10/90) blend irradiated over various time intervals using UV light intensity I = 0.01 mW cm−2 at 94 °C. From this result, it was found that the width of the normalized scattering intensity S(q) = I(q)/I(qmax) becomes narrower as the reaction time increases, revealing a mode selection process driven by photo-crosslink reaction of the PSAF component. To quantify the distribution of the periodic structures forming in the crosslinked blends, the normalized scattering intensity distribution S(q) was fitted to the following modified Gaussian function [18]:

where σ and qmax are, respectively, the standard deviation of the characteristic length scales of the morphology and the wavenumber corresponding to the maximal scattering intensity. On the other hand,  b, c and d are the constants characterizing the variation of the scattering intensity distribution with respect to the wavenumber q.

Figure 11. (a) The normalization plot obtained for a PSA/PVME(10/90) mixture under photo-crosslink using I = 0.01 mW cm−2. The numbers in the figure indicate irradiation time. (b) Evolution of the half width at half maximum (HWHM)n of the scattering intensity distribution obtained from (a).
Download figure:
Standard image High-resolution imageThe variation of the half width at half maximum (HWHM) with the irradiation time (tirr—to) obtained by fitting the scattering profile I(q) to equation (3), is shown in figure 11(b) for three light intensities, 0.01, 0.03 and 0.05 mW cm−2. It was found that the distribution Γ gradually decreases as the phase separation proceeds and eventually approaches a stationary width HWHM∞ which depends on the irradiation intensity. The stronger light intensity leads to narrower width of the characteristic length scales. This is clear evidence for the suppression of the long wavelength fluctuations in reacting mixtures and is a feature of reaction-induced phase separation. It should be noted that the phenomenon was first pointed out by Huberman for mixtures of small-molecule systems undergoing phase separation induced by autocatalytic reactions [19]. Two decades later, Glotzer and co-workers, who used the mathematical analogy between phase separation of block copolymers and of polymer mixtures, rediscovered the existence of a suppression process of long-wavelength fluctuations in phase separation driven by a reversible reaction [20]. These works triggered not only a series of theoretical studies on the mode selection in reacting mixtures [21–23], but also provided a different perspective on the experimental methods using chemical reactions to control the spinodal decomposition in polymer blends with photo-crosslink reactions [24–26] as well as experiments on thermo-settings [27, 28]. Recently, studies on using chemical reactions to generate and control the morphologies of polymer mixtures were extended from binary mixtures to ternary mixtures with spatio-temporal control of phase separation [29–31]. The fundamental question concerning the effects of deformation such as shrinkage or swelling associated with the chemical reaction on the phase separation process still remains unsolved though it is very important for practical applications in materials research such as in dental restorative materials [32, 33].
3.7. Comparison with phase separation driven by heat: Evidence for the mode selection in crosslinking-induced phase separation.
To clarify the roles of the photo-crosslink reaction in the induced phase separation process, a PSAF/PVME (15/85) mixture was submitted to a T-jump from 94 °C to 96 °C, which corresponds to a jump depth of ΔT = 1 °C. The time evolution of the corresponding scattering profile obtained for this particular condition was shown previously in figure 5(a). The width (HWHM) of the normalized scattering profiles observed after different elapsed times is displayed in figure 12(a). It was found that in contrast to the case of photo-crosslink reaction, the width Γ of the normalized scattering intensity distribution I(q)/I(qmax) increases with elapsed time for the case of the T-jump (in the absence of the crosslink reaction). The broadening of the HWHMn of the normalized distribution with irradiation time (tirr—to) illustrated in figure 12(b) is in contrast with the case of the photo-crosslink shown in figure 11(b), clearly indicating that the distribution of the characteristic length scales of the bi-continuous morphology resulting from the spinodal decomposition becomes broadened as the phase separation proceeds. Therefore, there is no mode selection for the case of phase separation induced by heating.

Figure 12. (a) The normalization plot obtained for a PSA/PVME(10/90) under a T-jump from 94 °C to 96 °C; (b) Evolution of the half width at half maximum of the scattering intensity distribution obtained from (a).
Download figure:
Standard image High-resolution image3.8. Phase separation of the blend at the boundary of the spinodal and nucleation-and-growth regions
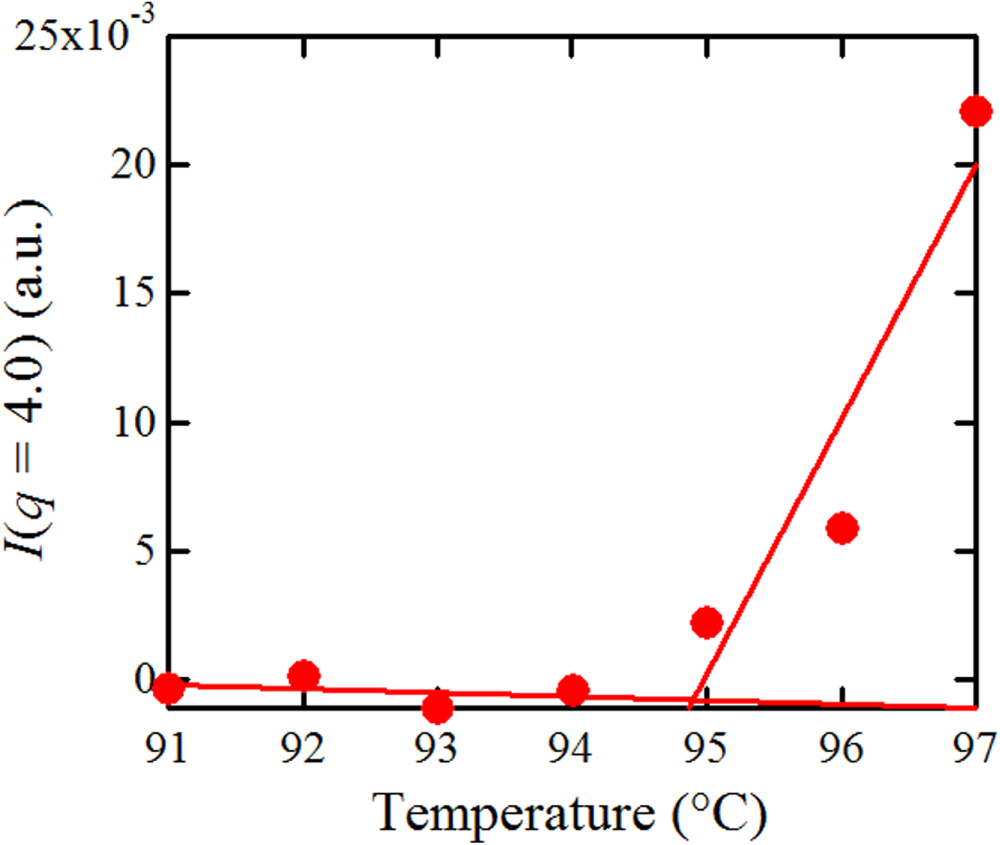
To observe the phase separation induced by photo-crosslinks of the PSAF component in the mixture, a PSAF/PVME  blend was irradiated with the intensity 0.1 mW cm−2 and the scattering intensity distribution I(q) was monitored. It was found that I(q) shows a broad peak at q = 4.5 μm−1 with amplitude increasing with irradiation time while its position remains unchanged during 280 min of irradiation. This result indicates that though the initial composition is quite deviated from the critical composition, the photo-crosslink mixture still entered the spinodal decomposition under irradiation with 365 nm UV light. On the other hand, upon decreasing the composition PSAF in the blend to PSAF/PVME (5/95), it was found that the scattering intensity I(q) first exhibits a very broad peak in the range 2.5 ∼ 4.0 μm as shown in figure 13(a). Subsequently, the broad peak gradually becomes insignificant in the first 200 min of irradiation and seems to be taken over by the strong scattering intensity in the low-q region. Though the precision is not high, the plot of ln I(q) versus q2 illustrated in figure 13(b) for the scattering data monitored after 300 min of irradiation can be fitted to the Guinier equation (2), qualitatively implying that at this particular irradiation time, the photo-crosslinked blend moves from the unstable (spinodal) region to the meta-stable (nucleation-and-growth) region. The radius of gyration Rg calculated from these scattering data is in the range 0.25 ∼ 0.35 μm. These experimental results indicate that the unstable–metastable crossover can be manipulated by changing the light intensity in polymerization-induced phase separation.

Figure 13. (a) Time evolution of the scattering profile obtained for a PSAF/PVME(5/95) mixture irradiated with 365 nm UV light with the intensity 0.1 mW cm−2. (b) The Guinier plot for the scattering process monitored after 300 min of irradiation.
Download figure:
Standard image High-resolution image
3.9. Correlation between the crosslink reaction and phase separation: Manipulation of morphology by photo-crosslink reaction
The correlation between the crosslink kinetics described in section 3.2 and the phase separation kinetics observed for a PSAF/PVME (10/90) mixture under two intensities 0.01 mW and 0.1 mW is shown respectively in figures 13(a) and (b). In these figures, the irradiation time at which the phase separation starts is shorter for higher light intensity, whereas the threshold crosslink density γc required for the mixture to enter the two-phase region is not significantly different, with the same ca. 3 crosslink points per chain. This implies that a constant crosslink density is required for the mixture to reach the two-phase region, regardless of the light intensity, providing a principle for controlling phase separation by chemical reactions.
4. Concluding remarks
Phase separation of a polystyrene derivative/poly(vinyl methyl ether) (PSAF/ PVME) blend was induced and controlled by photo-crosslink of the PSAF component. By using light scattering, the following results were obtained.
- (1)For PSAF/PVME blends with a lower critical solution temperature, a deep T-jump leads to a phase separation via the spinodal decomposition process, whereas a shallow T-jump induces phase separation via the nucleation-and-growth mechanism.
- (2)By photo-crosslinking the PSAF component using 365 nm UV light with the intensity ranging from 0.01 to 0.1 mW cm−2, it was found that the blend undergoes phase separation via the spinodal decomposition process. By decreasing the composition of the PSAF component, the spinodal nucleation and growth crossover was observed.
- (3)The significant difference between the phase separation induced by heating and that induced by photochemical reaction was experimentally found from the viewpoint of the mode selection process. For the phase separation induced by heating, no length scales were observed. These data indicate the existence of a self-ordering phenomenon in the polymer blend driven by photochemical reactions. These results would provide useful methods to design special polymers, such as multiporous or conducting materials, by taking advantage of the resulting co-continuous morphologies generated by the competition between polymerization and phase separation.
Acknowledgments
Q T-C-M greatly appreciates the financial support from the Ministry of Education, Japan (MONKASHO) via the grant-in-aid no. 26620181. R K thanks the Toyo Tire & Rubber Company for the support to pursue the PhD program at Kyoto Institute of Technology.