
Abstract
In recent years there has been excessive progress in the 'green' chemistry approach for the synthesis of gold and silver nanoparticles. Bimetallic nanoparticles have gained special significance due to their unique tunable optical properties. Herein we report a facile one-pot, eco-friendly synthesis of Au–Ag bimetallic core–shell nanoparticles using gripe water as reducing as well as stabilizing agent. The as-synthesized Au–Ag nanoparticles are characterized using UV–Vis spectroscopy to determine the surface plasmon resonance, and using transmission electron microscopy to study the morphology and the particle size. The optical nonlinearity of the bimetallic nanoparticles investigated by z-scan technique using femtosecond Ti:sapphire is in the order of 109. The nonlinear optical parameters such as the nonlinear refractive index n2, nonlinear absorption coefficient β and the third order nonlinear susceptibility χ3 are measured for various wavelengths from 700 nm to 950 nm. The Au–Ag nanoparticles are also used in surface enhanced Raman spectroscopic studies to enhance the Raman signals of rhodamine 6G.
Export citation and abstract BibTeX RIS

Original content from this work may be used under the terms of the Creative Commons Attribution 3.0 licence. Any further distribution of this work must maintain attribution to the author(s) and the title of the work, journal citation and DOI.
1. Introduction
Metal nanoparticles are of great interest because of their distinct optical properties and their advances in various applications such as catalysis, biosensing, drug delivery and other physiochemical, optoelectronic properties and surface enhanced Raman scattering and detection [1–10]. The bimetallic nanoparticles, with core–shell structures are commonly synthesized using chemical reduction technique and by seed growth methods. Usually the synthesis procedure involves the reduction of metal ions using a reducing agent and capped by another stabilizing agent. The use of such reactive chemicals poses potential risk to the environment. Hence, there is a growing need to develop clean, nontoxic and environmental friendly 'green chemistry' approaches to synthesis of nanoparticles [11]. Recent green chemistry methods for the synthesis of gold and silver nanoparticles used leaf extract of Cassia angustifolia [12], Daucus carota (D. carota) extract [13], honey [14], edible mushroom extract [15], hibiscus rosa sinensis [16], banana peel extract [17] and mulberry leaf extract [18].
In our previous work [19], we have reported the synthesis of gold nanoparticles with size and dispersity control using gripe water. Adopting a similar method, in this work we present the complete 'green' synthesis of Au–Ag core–shell nanoparticles reduced and stabilized at room temperature using gripe water. This is a facile one-pot method for the synthesis of Au–Ag nanoparticles. Gripe water is a well-known antacid, which is prescribed to treat gripe, indigestion and acidity for infants [20]. It is easily available in all medical stores all over the world. The as-synthesized nanoparticles are characterized using UV–Vis spectroscopy and transmission electron microscopy (TEM). The optical nonlinear behavior of the nanoparticles is analyzed using single beam z-scan technique. Nonlinear optical parameters n2, β and χ3 of the Au–Ag nanoparticles are analyzed and calculated using closed and open aperture z-scan. The as-synthesized nanoparticles are applied in surface enhanced Raman spectroscopic (SERS) analysis. The enhancement of rhodamine 6 G dye is analyzed by adding the bimetallic nanoparticles.
2. Experimental
2.1. Materials
Chloroauric acid HAuCl4 and silver nitrate AgNO3 are purchased from Sigma-Aldrich. Woodward's gripe water is purchased from TTK Health Care Ltd, INDIA. Millipore water (18 MΩ) is used as solvent in our experiments.
2.2. Characterization
The surface plasmon bands of the particles are recorded using UV–Vis spectrometer. The absorption spectra for all the particles are recorded using Shimadzu spectrometer, with a resolution of 0.5 nm taking the nanoparticles in a 10 mm optical length quartz cuvette. The particle size and shape have been monitored using a high resolution transmission electron microscope (HR-TEM, JEOL JEM 3010) operated at 200 kV. Samples for TEM images are prepared by placing a drop of colloidal silver on carbon coated copper grid 300 mesh. The IR spectra are recorded on JASCO FT/IR-4100 Fourier transform infrared spectrometer in the range 400–4000 cm−1 with a resolution of 4 cm−1. The z-scan studies were performed using a tunable, mode locked Ti:sapphire at a repetition rate of 80 MHz with a pulse width of 160 fs laser beam (Mai Tai—deep SEE) focused by a lens of 32 mm focal length. A photodetector (COHERENT) connected to the digital power meter Field Master Gs-COHERENT measured the laser power. The Raman spectra for the SERS studies are recorded using a LabRAM HR800, Jobin Yvon, France, with an 80 cm focal length spectrometer and a He-Ne 633 nm with 11 mW power on the sample. The spectra are acquired over a wavenumber region of 1800 to 600 cm−1 with an acquisition time of 10 sec.
2.3. Synthesis of Au–Ag nanoparticles
The core–shell nanoparticles were prepared by taking the source solutions of HAuCl4 and AgNO3 in 1:1 molar ratio. To the stirring source solution of 10 mL of gripe water and 0.3 mM of AgNO3 was added to 0.3 mM of HAuCl4 and kept under continuous stirring.
3. Results and discussion
3.1. Surface plasmon resonance
During the synthesis procedure, gripe water and AgNO3 are added together to HAuCl4 solution to avoid precipitation of AgCl. Although the reducing agent is added to both the source solutions at the same time, Au nanoparticles are formed first as the growth kinetics of Au is faster than that of the Ag nanoparticles. Therefore Au–Ag nanoparticles are grown by successive reduction of HAuCl4 and AgNO3 by gripe water. The nanoparticles attained saturation only after 22 h of reaction. The characteristic surface plasmon band (SPR) of the as-prepared nanoparticles is observed only after one hour of reaction at 463 nm. Figure 1(a) illustrates the time dependent SPR band of the nanoparticles and figure 1(b) shows the SPR band of the Au–Ag core–shell nanoparticles. From time dependent UV–Vis spectrum, it is seen that the SPR band of the nanoparticles increases in intensity and peak broadening is not observed. This implies that the number of nanoparticles increases and the size does not vary. The SPR band of the observed nanoparticles is at 463 nm for the Au–Ag core–shell nanoparticles. Every 5 ml of used gripe water contains (as per its label) sodium bicarbonate (Sarjikakshara) of 0.05 g, dill oil (Anethum Graveolens) of 0.005 ml, sugar of 1.1 g with the preservatives bronopol, sodium benzoate, sodium methylparaben, and sodium propylparaben. Sodium benzoate, sodium methyl paraben, sodium propylparaben, and bronopol (also called 2-bromo 2-nitropropane1,3-diol) present in gripe water stabilize the nanoparticles, while sodium bicarbonate and sucrose reduce the Au–Ag nanoparticles.

Figure 1. (a) Time dependent surface plasmon band of Au–Ag nanoparticles reduced using gripe water, (b) surface plasmon band of Au–Ag nanoparticles reduced using gripe water.
Download figure:
Standard image High-resolution image3.2. Transmission electron microscopy
A transmission electron microscope (TEM) is used to decipher the surface morphology and the particle size of the synthesized nanoparticles and the images are shown in figure 2. The TEM images reveal that the bimetallic nanoparticles are core–shells structures, with Au as core and Ag as shells. It is difficult to distinguish Au and Ag from the TEM images as both they have the same lattice parameters, yet with the high electron density of Au atoms, the Au core is differentiated with the Ag shell. The average particle size of the Au–Ag nanoparticles attained from TEM images is found to be 10 nm.

Figure 2. TEM images of Au–Ag core-shell bimettalic nanoparticles synthesized using gripe water given in different scales. (a) 20 nm and (b) 10 nm.
Download figure:
Standard image High-resolution image3.3. Z-scan: nonlinear optical properties
Using the single beam z-scan technique, the nonlinear optical behavior of the Au–Ag nanoparticles is studied [21]. The closed aperture z-scan technique is used to measure the sign and magnitude of the nonlinear refraction n2 of the nanoparticles, while the open aperture z-scan quantifies the nonlinear absorption coefficient β. The experimental set up of z-scan is schematically represented in figure 3. The Au–Ag nanoparticles whose nonlinearity is to be studied is taken in colloidal form in quartz cuvette with a width of 1 mm and mounted on a translation stage. Along the direction of propagation of the laser beam, the stage is moved across the z direction from −10 to +10 mm (−z to +z).

Figure 3. Schematic set up of z-scan using Ti:sapphire femtosecond laser.
Download figure:
Standard image High-resolution imageThe intensity of the laser beam transmitted from the sample is collected and measured through an aperture by a photo-detector attached to the digital power meter for the closed aperture z-scan, while in the case of open aperture the aperture is removed and the entire laser beam is focused into the detector through a lens. When the sample is moved towards the focus of the lens z = 0, the beam irradiance increases leading to pre-focal peak and when moved away from the focus, the beam irradiance decreases suddenly leading to post-focal valley. This shows the negative nonlinearity of the nanoparticles. The nonlinear refractive index n2 is deduced from the closed aperture and the nonlinear absorption coefficient β is inferred from the open aperture z-scan. The optical nonlinear parameters are obtained from equations


where n2 is the nonlinear refractive index, k is the wave number (k = 2π/λ) and ΔΦ0 is the on-axis phase shift at the focus, I0 is the peak intensity within the sample at the focus, Leff is the effective thickness of the sample (1 mm—quartz cuvette), S is the linear aperture transmittance (0.5) and ΔTp-v is the normalized peak valley differences obtained from the closed aperture z-scan trace, ΔT = 1−Tp, where Tp is the normalized peak value from the open aperture plot [22–25]. Third order nonlinear susceptibility χ3 of the nanoparticles were obtained using the relations as in equations


where, ε0 = 8.854 × 10⁻¹⁴ F m−1 is the vacuum permittivity, c is the speed of light in vacuum (3 × 1010 cm sec−1) and n0 is the linear refractive index (1.33). The real part Re(χ3) is proportional to the nonlinear refractive index of the nanoparticles, while the imaginary part Im(χ3)' is proportional to the nonlinear absorption coefficient β. Z-scan is carried out for different incident wavelengths from 700 nm to 950 nm. The measured nonlinear parameters of the prepared Au–Ag core–shell nanoparticles are tabulated in table 1. Closed and open aperture z-scan plots of the nanoparticles for different wavelengths are illustrated in figure 4.
Table 1. Measured nonlinear parameters of Au–Ag nanoparticles.
| λ (nm) | ΔTp-v | ΔΦ0 | n2 × 10−8 (cm2 W−1) | β × 10−3 (cm W−1) | χ3 × 10⁻¹⁰ (esu) |
|---|---|---|---|---|---|
| 700 | 0.71 | 2.13 | 1.18 | 1.69 | 5.30 |
| 750 | 0.80 | 2.40 | 1.42 | 1.56 | 6.39 |
| 800 | 0.87 | 2.61 | 1.65 | 1.45 | 7.42 |
| 850 | 0.94 | 2.82 | 1.89 | 1.34 | 8.51 |
| 900 | 1.00 | 3.00 | 2.13 | 1.12 | 9.57 |
| 950 | 1.09 | 3.27 | 2.45 | 1.23 | 11.03 |
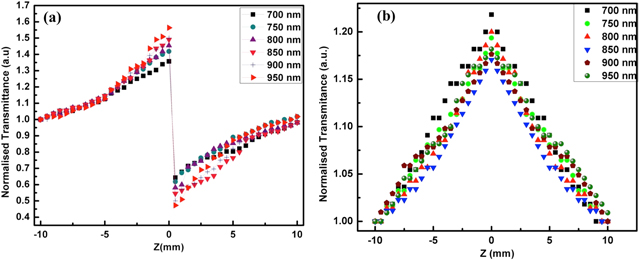
Figure 4. Z-scan plot of Au–Ag nanoparticles. (a) Closed aperture and (b) open aperture.
Download figure:
Standard image High-resolution imageThe as-synthesized Au–Ag nanoparticles indicate negative nonlinearity as their closed aperture z-scan traces show peak followed by valley. The nonlinear refractive index n2 of the nanoparticles is in the order of 10−8 cm2 W−1. The n2 value increases from 1.18 to 2.45 × 10⁻⁸ cm2 W−1 with the increase in the incident wavelength for the bimetallic nanoparticles. The nonlinear absorption coefficient β obtained from the open aperture z-scan decreases from 1.69 to 1.23 × 10⁻³ cm W−1 with the increase in wavelength. The third order nonlinear susceptibility χ3 increases with the increase in the incident wavelength. Variation of the nonlinear optical parameters n2, β and χ3 with wavelength is shown in figure 5. The concentration of the as synthesized Au–Ag nanoparticles is obtained from inductive coupled plasma (ICP). The concentration of Au is 0.250 mol L−1 and Ag is 0.310 mol L−1.

Figure 5. Variation of the nonlinear parameters. (a) n2, (b) β and (c) χ3 of Au–Ag nanoparticles with wavelength.
Download figure:
Standard image High-resolution image3.4. SERS analysis
Surface enhanced Raman scattering (SERS) of rhodamine 6G (R6G) dye molecules is studied using the bimetallic Au–Ag nanoparticles. In general the SERS studies are carried out by coating the probe molecules to be studied to the metal nanoparticles on a substrate. This leads to hot-spots, with large enhancement occurring at the junctions between the nanoparticles. The hot-spots are the regions where the enhancement is substantially increased due to a number of factors [26, 27]. However in this study there are no such constraints as the whole experiment is carried out as such in liquid state. The Au–Ag nanoparticles and the rhodamine 6G dye solution are taken in liquid form in a quartz cuvette. This leads to the enhancement of all the predominant peaks of the dye. The concentration of the dye R6G was very low as high concentrations led to blinding of the Raman signals. Equal volume ratio (1:1) of R6G (1 × 10⁻¹² M) and nanoparticles is taken for the analysis as this ratio resulted with maximum enhancement of Raman signal. SERS enhancement factor (EF) is defined as the ratio of the enhancement obtained to what would be obtained for the same molecule in non-SERS conditions [28]. The average SERS EF is calculated according to the formula

where I0 and ISERS are the peak intensities of the Raman measurement under normal and SERS conditions, respectively [29], N0 and NSERS are the number of R6G molecules in the scattering volume for the normal Raman measurement and SERS measurement, respectively. The SERS spectrum of rhodamine 6G enhanced using Au–Ag nanoparticles is shown in figure 6.
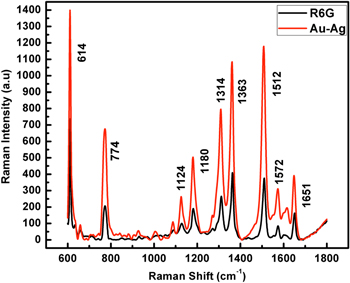
Figure 6. Surface enhanced Raman spectrum of rhodamine 6G using Au–Ag core–shell nanoparticles.
Download figure:
Standard image High-resolution image
The vibrational bands of the R6G dye are from 1800 to 600 cm−1. The vibrational bands observed in the R6G spectra from 1314–1651 cm−1 are due the aromatic C-C stretching. The other wavenumber 1124 cm−1 is a weak band due to the C-H (ip) bend, while 774 cm−1 arises from the C-H (oop) bend and 614 cm−1 is due to C-C-C (ip) bend [30]. After the addition of nanoparticles to the dye all the nine distinctively seen peaks are enhanced and their enhancement factor is obtained. The enhancement factor is calculated by averaging the enhancement of all the peaks. The average EF attained is 2.72 × 10⁹. Our results also show that the core–shell nanoparticles act as good analytes for surface Raman scattering of rhodamine 6G dye.
4. Conclusion
In essence, gripe water is used to develop a facile and a complete green method to synthesize Au–Ag bimetallic nanoparticles at room temperature with great ease. The synthesized nanoparticles are core–shell structures with Au being the core and Ag as the shell. The as-synthesized nanoparticles are subjected to nonlinear optical studies by z-scan using Ti:sapphire femtosecond pulses and tuning the wavelength from 700 nm to 950 nm. The nonlinear optical parameters such as the nonlinear refractive index n2 are found to be in the order of 10−8 cm2 W−1, nonlinear absorption coefficient β is obtained in the order of 10−3 cm W−1 and the third order nonlinear susceptibility χ3 is in the order of 10−10 (esu). The Au–Ag nanoparticles are highly compatible with the dye rhodamine 6G and the surface Raman scattering enhancement due to the nanoparticles is observed and the average enhancement factor is found to be in the range of 109. Hence, this study proves to be an excellent tool for the enhancement of Raman signals and can be extended for biosensing.
Acknowledgment
Author P K Palanisamy acknowledges the Emeritus fellowship award of University Grants Commission (UGC), New Delhi.