
Abstract
In this paper we present a sensing method using nano-porous silicon microcavity sensor, which was developed in order to obtain simultaneous determination of two volatile substances with different solvent concentrations as well as very low pesticide concentration in water. The temperature of the solution and the velocity of the air stream flowing through the solution have been used to control the response of the sensor for different solvent solutions. We study the dependence of the cavity-resonant wavelength shift on solvent concentration, velocity of the airflow and solution temperature. The wavelength shift depends linearly on concentration and increases with solution temperature and velocity of the airflow. The dependence of the wavelength shift on the solution temperature in the measurement contains properties of the temperature dependence of the solvent vapor pressure, which characterizes each solvent. As a result, the dependence of the wavelength shift on the solution temperature discriminates between solutions of ethanol and acetone with different concentrations. This suggests a possibility for the simultaneous determination of the volatile substances and their concentrations. On the other hand, this method is able to detect the presence of atrazine pesticide by the shift of the resonant wavelength, with good sensitivity (0.3 nm pg−1 ml) and limit of detection (LOD) (0.8–1.4 pg ml−1), that we tested for concentrations in the range from 2.15 to 21.5 pg ml−1, which is the range useful for monitoring acceptable water for human consumption.
Export citation and abstract BibTeX RIS

Original content from this work may be used under the terms of the Creative Commons Attribution 3.0 licence. Any further distribution of this work must maintain attribution to the author(s) and the title of the work, journal citation and DOI.
1. Introduction
Porous silicon microcavities (PSMCs) allow realizing convenient and low-cost optical devices for the determination of organic solvents and pesticide content with very low concentration in liquid solutions, so that PSMC devices show promise for simple and portable instruments for liquid-phase environment pollutant monitoring. Owing to high specific surface area [1], porous silicon (PS) is an ideal transducer material for sensors of liquids [2, 3] and vapors [4, 5]. Recently, PS optical sensors have been designed in the structure of one-dimensional photonic crystal devices such as optical filters [6] and microcavities [7]. The principle of these sensors is the determination of the photonic crystal spectral shift caused by refractive index change of the nano-porous silicon layers in the device due to the interaction with liquid or gas. It was shown from the principle that the response of the sensor depends only on refractive index and therefore lacks specificity for the studied substances. Consequently, most current sensors based on the PS photonic crystal only determine the concentration of a defined substance. It is possible to use a physical or chemical method to overcome this drawback. A commonly used chemical method is the functionalization of the surface of silicon nanocrystals in the porous layers [8, 9]. It is a chemical process to create the new chemical bond that combines selectively with molecules of the studied substances. The number of published works, which used a physical method to identify the analyses, in sensors based on photonic crystals has been limited. Sailor and co-workers [10] have applied temperature cycles to a porous silica photonic crystal embedded in pure chemical vapors and therefore he was able to distinguish between isopropanol, heptane, and cyclohexane, Patel et al [11, 12] have demonstrated the detection of glucose and methyl parathion by nano-scale porous silicon microcavity sensors. The sensitivity of optical sensors, defined as the ratio of the wavelength shift and the change of the ambience refractive index, depends on the concentration change of the solution and can be enhanced by designing suitable structural parameters such as thickness, porosity, number of porous layers in the device [13] or creating a stress on the sensor surface [14]. In our previous work we developed nano-porous silicon microcavity sensor for determination of ethanol and methanol concentration adulterated with gasoline [15].
This paper presents a developed method using a porous silicon microcavity sensor for the determination of organic solvents and pesticides such as an atrazine with very low concentration in the water. We set up the measurement, in which the temperature of the solution and the velocity of the airflow containing the solvent gas from solutions of ethanol and acetone control the response of the sensor. As mentioned above, the sensor uses the physico-chemical properties of the analyzed substances as 'characteristic signals' involved in the response of the sensor. The sensor response is given by the shift of the resonant wavelength of the microcavity when sensors are immersed in the flow of solvent vapor. We present a study of the dependence of the wavelength shift on solvent concentration, velocity of the airflow and solution temperature. Considering this dependence, we hope to find out the ability to enhance the sensitivity of the sensors and the specificity of the measurement.
2. Experimental
Porous silicon microcavities were fabricated by an electrochemical method in a process that was presented in our previous work [16]. In particular, the electrochemical process was carried out on a (100)-oriented highly boron-doped p-type Si wafer (resistivity is of 0.01–0.1 Ωcm) in a 16% hydrofluoric acid (HF) solution and ethanol at various current densities. Aluminum was evaporated onto the backside of the Si wafer and then it was annealed at 420 °C in nitrogen atmosphere for 45 min in order to ensure a good Ohmic contact. The electrochemical process was controlled by computer program using Galvanostat equipment (Autolab PGSTAT 30) so precise control over electrical current and etching time was achieved. Before electrochemical etching, the Si wafer was dipped in 5% HF solution for a minute to remove the native oxide. The electrochemical anodization cell was made of polytetrafluoroethylene (Teflon) resin and was designed to have an exposed etching area of approximately 0.79 cm2. After anodization, the sample was washed with 98% ethanol and dried in primary vacuum. For converting the surface of the silicon nano-crystals from hydrophobic to hydrophilic, we oxidized the as-prepared sample in an ozone atmosphere for 45 min by using an ozone generator (H01 BK Ozone with a capacity of 500 mg h−1).
Cross-sectional and top view images of the porous silicon microcavity were obtained using an ultra resolution field-emission scanning electron microscope (FE-SEM) S-4800. Figure 1 shows a plan-view and cross-section images of the microcavity based on (HL)3.5LL(HL)3 porous silicon multilayer structure, where H and L labels correspond to high and low refractive index layers, respectively; 3.5 means three and half pairs of HL. We chose a structure with 3 and 3.5 pairs of HL, because this gives a good reflectivity spectrum and easily repeatable electrochemical etching process. The thicknesses of high and low refractive layers were 72 nm and 87 nm with accuracy of ±2 nm, respectively. This structure was obtained from anodization current density of 15 mA cm−2 and 50 mA cm−2 and with etching time of 5.56 s and 2.86 s for high and low refractive index layers, respectively. For measurement of reflective spectra of the samples, we used an ultraviolet-visible-near infrared (UV–vis-NIR) spectrophotometer (Varian Cary 5000) and a spectrometer (S-2000, Ocean Optics) with a resolution of 0.1 and 0.4 nm, respectively. The light source was a tungsten halogen lamp (Z 19, Narva).

Figure 1. (a) SEM plan-view and (b) cross-section images of a porous silicon microcavity design in the (HL)3.5LL(HL)3 structure.
Download figure:
Standard image High-resolution imageFigure 2 shows the reflectivity spectra of the microcavity before and after oxidization. The blue shift of the resonant wavelength after oxidization is due to a decrease in the effect of refractive index of the porous layers in the microcavity [16]. From experimental results we calculated refractive indices of 2.1 and 1.75 for high and low refractive index layers, respectively.
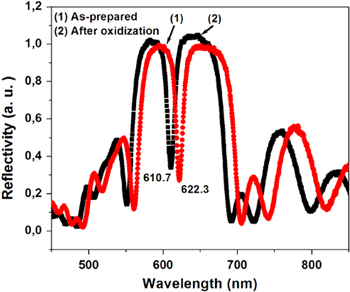
Figure 2. Reflective spectra of the porous silicon microcavity as-prepared (curve 1) and after oxidization in the ozone ambience (curve 2).
Download figure:
Standard image High-resolution imageFigure 3 shows the schema of the concentration measurement for volatile organics by using a vapor sensor based on a porous silicon microcavity. In this schematic, valve 2 works as a controller of velocity of air stream though the flow meter, the test solvent chamber and the sample chamber. Valve 1 is only open to refresh the porous matrix after measurement. The thermostat controls the temperature of the liquid in the range from room temperature to 100 °C.

Figure 3. Schema of the concentration measurement for volatile organics by using a vapor sensor based on the porous silicon microcavity. Valve 1 and valve 2 are used to guide the airflow from a pump into the sample chamber. The arrows indicate the direction of the air or vapor flows.
Download figure:
Standard image High-resolution imageIn our experiment we use an optical fiber splitter BIF200 UV–VIS for light irradiation to samples and for collecting the reflective spectrum of the microcavity. We have also used an LM35D integrated circuit for measuring the temperature in the sample chamber. It is shown that this temperature was not affected by the solution temperature nor by the air rate in our experimental setup. Each experimental data run takes from 5 min to 7 min depending on the velocity of the airflow. A standard deviation of the wavelength shift from the average value of 5 experimental data runs is 0.6 nm.
3. Results and discussion
3.1. Nano-porous silicon microcavity sensor for detection of organic solvents in the gasoline
The basic characteristics of the porous silicon microcavity (PSM) and the resonant wavelength shift (Δλ) caused by the ambient refractive index (n) were determined experimentally by using a series of liquids with known refractive indices. The effective refractive index of the nano-porous silicon layer immersed into organic solvent would be increased due to the substitution of air with liquid in the pores and consequently the optical thickness of the layer is increased. As a result, the resonant wavelength shift would be dependent upon the refractive index value of the organic solvent. Table 1 presents a series of organic solvents such as methanol 99.5%, ethanol 99.7%, isopropanol 99.7% and methylene chloride 99.5% (product of NHTC-China) with their refractive index and resonant wavelength of the sensors, when they are dipped into corresponding organic solvent for some minutes.
Table 1. Various organic solvents with known refractive index and resonant wavelengths of sensors based on porous silicon microcavity dipped in corresponding solvent.
| Organic solvent | Refractive index | Resonant wavelength (nm) |
|---|---|---|
| Air | 1.0003 | 504.75 |
| Methanol (99.5%) | 1.3280 | 572.05 |
| Ethanol (99.7%) | 1.3614 | 579.00 |
| Isopropanol (99.7%) | 1.3776 | 583.17 |
| Methylene chloride (99.5%) | 1.4242 | 592.85 |
Sensitivity (Δλ/Δn) is one of the most important parameters for evaluating the performance of the sensors. Using the experimental data in table 1, we calculate the sensor sensitivity of about 200 nm RIU−1. The Spectrophotometer Varian Cary 5000 is able to detect a wavelength shift of 0.1 nm, and then the minimum detectable refractive index change in the porous silicon layer is less than 10−3. Experiment shows that after complete evaporation of organic solvent, the reflectance spectra of the sensors return to their original waveform position (as in the air). In our case the evaporation of organic solvents in open air at room temperature was completed for 40–50 min, but this process can occur for 20 s when the samples were in the vacuum chamber with 10−1 torr. That means, the change of sensor reflectance spectra are temporary and it is useful for reversible optical sensing.
An important parameter of the microcavity sensor is the change of the refractive index of the porous layer. It depends on the refractive index of the liquid as well as the porosity of the porous layer. In Bruggeman effective medium approximation, the relation between effective refractive index of the pore layers ( ), silicon refractive index (nsi = 3.5), void refractive index (nvoid = 1) and porosity (P) is presented by following equation

Based on this relation we determined the porosity (P) of the pore layer and the refractive index of the pore layer ( ) dipped in liquid with known refractive index. The simulation calculations for basic characteristics of sensor consist of the following steps:
- (i)Determination of refractive index of the defect layer based on the experimental resonant wavelength and the pore layer thickness from scanning electron microscopy (SEM) image.
- (ii)Determination of layer porosity in the air using the relation (1). When the refractive indices of the pore layers in air changed from 2.739 to 1.323, the porosity of the layer changed from 30 to 80 by calculation.
- (iii)Determination of effective refractive index of layer when the voids were filled by liquid with known refractive index using relation (1).
- (iv)Determination of resonant wavelength of sensor dipped into liquid using the simulation reflectance spectra.
Simulation shows that the contrast of the porosities (i.e. refractive indices) of the layers strongly influences the wavelength shift (i.e. the sensitivity) of the microcavity. The contrast of the porosities would be high when the change of current density was large in the electrochemical etching process. However, experiment shows that the imperfection of the interfaces of layers increased with the large change of current densities. In our work, when the porosity contrast of layers is more than 40, the reflective spectra of the device are deformed in the reflection intensity and the line-width of transmittance zone.
The curves from C1 to C4 in figure 4 present the fitting process of sensor basic characteristics by simulations with that by experiment (curve E). The fitting showed that the porosity contrast between two layers affects the sensor sensitivity (Δλ/Δn). Consequently, the matching process found suitable porosity of 34% and 72% of low and high porosity layers of the prepared sensor, respectively.
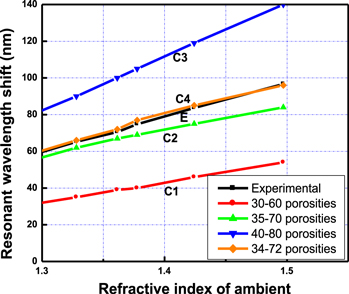
Figure 4. The basic characteristics of liquid-phase sensor prepared from porous silicon microcavity obtained in experiment (curve E), and by simulation calculations (curves C1, C2, C3, C4) with various pairs of porosities.
Download figure:
Standard image High-resolution imageThe microcavity-based sensors have been applied to determination of different solutions of ethanol and methanol in the commercial gasoline A92.
Figure 5 shows the measured results of the resonant wavelength shift of the microcavity sensor immersed into gasoline A92 with different concentrations of ethanol and methanol. In the case of a mixture of ethanol/A92, a resonant wavelength shift is of 3.6 nm, when ethanol concentration changed in the range from 5% to 15% in the gasoline. With the sensitivity of the sensor as described above, the minimum determination of ethanol concentration change in the gasoline is of about 0.4%. In the case of methanol/A92, wavelength shifts are of 7.2 nm between the 5% and 15% methanol mixtures, respectively. From these experimental data, we suppose that the elaborated sensor can distinguish change of about 0.2% in concentration of methanol in the gasoline.
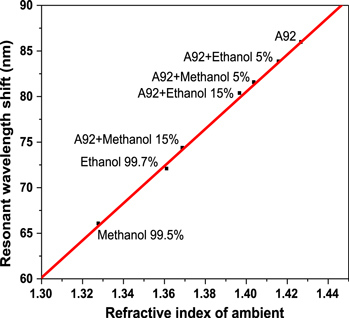
Figure 5. Response characteristics of the sensor wavelength shift for a mixture of methanol and ethanol different concentrations and commercial gasoline A92.
Download figure:
Standard image High-resolution image3.2. Nano-porous silicon microcavity sensor to simultaneously detect organic solvents
It is known that the response of the sensor depends on solvent vapor pressure in the sensor chamber [17]. This vapor pressure is related to the vapor pressure of the solvent in the solution chamber through a gas stream flowing through the solution. Assuming that the vapor pressure in the solution chamber obeys the rules of vapor pressure in a closed system, the relation between the wavelength shift (Δλ), the vapor pressure in the solution chamber (Psolution) and the velocity of airflow (V) is crudely presented as  , where
  is an empirical function of V, which shows dependence of concentration of solution on the velocity of airflow. The Psolution can be calculated by the following formulae [18]


where Pi is the vapor pressure of a particular substance, Xi is the corresponding mole fraction of that substance, A, B and C are component-specific constants (the coefficients of Antoine's equation), 'i' is an indexing component that keeps track of each substance in the solution.
Equations (2) and (3) show that Δλ is a function of V, Xi and Pi(T). Below we consider those relations in the experiment. We carried out experiments on ethanol and acetone solution. These are very common organic solvents and some of their physical properties such as boiling point, refractive indices and Antoine's coefficients from [18] are shown in table 2.
Table 2. Physical properties of acetone and ethanol.
| The coefficients of Antoine's equation | (a) Pị (T) (mmHg) | (a) dPi/dT (mmHg °C−1) | ||||||
|---|---|---|---|---|---|---|---|---|
| Solvent | Boiling point (°C) | Refractive index | A | B | C | T = 30 °C | T = 30 °C | T = 50 °C |
| Ethanol | 78.5 | 1.361 | 8.05 | 1554.3 | 222.65 | 78.154 | 480.802 | 1259.4 |
| Acetone | 56.2 | 1.359 | 7.03 | 1161.0 | 224 | 284.187 | 1299.00 | 2596.1 |
aCalculated results by Antoine's equation (3).
Figure 6 shows the dependence of Δλ on T, Δλ(T), for acetone and ethanol solutions with various concentrations at the airflow velocity of 0.84 ml s−1. Equations (2) and (3) show that we can consider the temperature dependence of Δλ(T) as the temperature dependence of Pi(T) modified by multipliers Xi if it was assumed that the contribution of water to solution pressure is small. Experimental data from curve 1, which describes Δλ(T) of the water, shows the validity of this assumption in our measurement. Pi(T) steadily increases as temperature increases (i.e. a monotonically increasing function), so the curves of solvent solutions with various concentrations are separate; for example, the curves 2–4 of ethanol solutions or the curves 5–7 of acetone solutions. Using equation (3) we calculated the rate of change of Pi(T) for acetone and ethanol in the range of temperature from 30 °C to 50 °C and its values are presented in table 2.
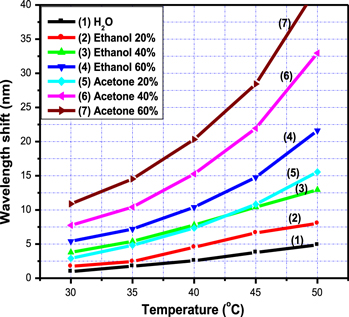
Figure 6. The dependence of the wavelength shift on the solution temperature for pure H2O (curve 1), 20–60% ethanol (curves 2–4), and 20–60% acetone (curves 5–7) at V = 0.84 ml s−1.
Download figure:
Standard image High-resolution imageThe slope of Pacetone (T) is greater than that of Pethanol (T) in the studied range of temperature (see table 1), so the curves describing Δλ(T) of acetone and ethanol solutions are intersecting with each other not more than one time (for example: curves 3 and 5), or not intersecting (for example: curves 3 and 4). Consequently, a curve describing Δλ(T) characterizes the solution of acetone (or ethanol) at a given concentration. In other words, the dependence of the wavelength shift on the solution temperature discriminates between solutions of ethanol and acetone with various concentrations [19].
Figure 7 shows the dependence of the resonant wavelength shift Δλ(C) on ethanol concentration, when velocity of the airflow (V) and temperature of the solution (T) work as parameters in the measurements. It can be seen in figure 7 that the curve described by Δλ(C) is linear and its slope, i.e. sensitivity of the measurement, increases as V and T increase. These remarks are also deduced from equations (2) and (3) when Xi is a variable, and T and V are parameters. Linearity of this dependence is a favorable condition for determination of solvent concentration. The increase of the slope creates an increase in sensitivity received from the measurement. From data in curves 2 and 3, which were received from the measurement with parameters T and V at 45 °C and 0.84 ml s−1, and at 30 °C and 1.68 ml s−1, we obtain the difference of Δλ of about 18.5 nm and 10.0 nm, respectively, between 0% and 100% ethanol. However, having measured with this sensor in the liquid phase in this concentration range, we obtained the Δλ difference of about 5 nm only [20]. Therefore, the sensitivity received from the measurement in the vapor phase with the value of T and V at 45 °C and 0.84 ml s−1, and at 30 °C and 1.68 ml s−1 increases 3.7 and 2.0 times, respectively, as compared with that in the liquid phase. We expect that the sensitivity of the measurement can be strongly improved with a reasonable combination of both parameters T and V.

Figure 7. Dependence of the wavelength shift on ethanol concentration when the velocity of air flow (V) and temperature of solution (T) work as parameters in the measurements. Curves 1–3 received from measurements with pairs of these parameters such as V = 0.84 ml s−1 and T = 30 °C, V = 0.84 ml s−1, T = 45 °C, V = 1.68 ml s−1 and T = 30 °C, respectively.
Download figure:
Standard image High-resolution imageFigure 8 shows the dependence of Δλ on V, Δλ(V), at a temperature of 30 °C when concentration of ethanol and acetone work as the parameters. It can be seen in figure 6 that curves describing Δλ(V) are separate straight lines with different concentrations of acetone and ethanol. This shows that empirical function θ(V) is a linear function of V. Now, we consider properties of the slopes of curves in figure 8. According to equation (2), the slope of the curve describing Δλ(V) increases as Pi and Xi increase. We apply the obtained results for curves 2 and 3 received from measurements with ethanol and acetone solutions at the same concentration (20%). It can be seen that the vapor pressure of acetone is larger than that of ethanol (see table 2), so the slope of curve 3 is larger than that of curve 2. We also apply the results for curve 2 and 4 received from measurements with ethanol concentrations at 40% and 20%. The slope of curve 4 is larger than that of curve 2 due to the greater value in the concentration.
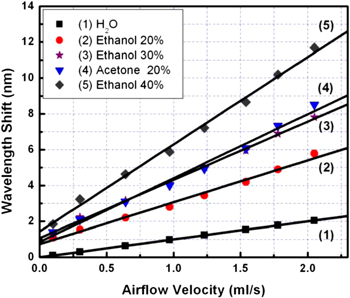
Figure 8. Dependence of the wavelength shift on the airflow velocity in the range 0–2.5 ml s−1.
Download figure:
Standard image High-resolution imageIt is deduced from figure 8 that dependence of the wavelength shift on velocity of the airflow is linear, and the slopes Δλ/ΔV are 2.4 nm ml−1 s−1 and 3.7 nm ml−1 s−1 for the same concentration of 20% ethanol and acetone solutions, respectively. In addition, when the concentration of organic solvent increases, the slopes Δλ/ΔV would be enhanced (for example, the value of Δλ/ΔV enhanced from 2.4 nm ml−1s to 3.4 and 5.1 nm ml−1 s−1 when the concentration of ethanol increased from 20% to 30% and 40%, respectively). Based on this phenomenon, we can simultaneously determine the kind and concentration of organic content in the solutions. For example, 40% ethanol and 20% acetone have similar temperature dependence (see figure 6) but can be discriminated by their air flow velocity dependence, and while 30% ethanol and 20% acetone have similar air flow velocity dependence (as can be seen from figure 8), they can be discriminated by their temperature dependence.
3.3. Nano-porous silicon microcavity sensor for detection of pesticide concentration in water
The very low concentration of atrazine solutions was obtained by dilution from mixture, obtained by stirring 21.5 mg of atrazine in 1000 ml of ultrapure water and a minimum amount of ethanol to ensure solubility (concentration of atrazine was of about 21.5 ppm or 10−4 M). To determine very low concentrations of atrazine solutions in the range between 2.15 and 2.15 × 10⁶ pg ml−1 (from 10−11 to 10−4 M), we have measured the cavity-resonant wavelength shift of the nano porous silicon microcavity sensors with various conditions: atrazine in pure water and in an aqueous solution of a humic acid (HA, 0.2 mg ml−1) extracted and purified from soil. Humic acid solutions were chosen to represent systems similar to natural conditions where water-containing pesticides also dissolve organic matter as component [21]. When an atrazine solution dropped on to sensor surface, the solution would partially substitute the air in the pores of each layer of sensor device caused a change of its refractive index. We observed a repeatable completely reversible change in the cavity reflectivity spectrum.
To test the performance of the optical sensor for the determination of atrazine pesticide, we studied the wavelength shift in the reflectance spectra with various conditions: in air, in pure water and in humic acid (HA). The effective refractive index of the nano-PSMC layer immersed into solutions would be increased due to the substitution of air with liquid in the pores, and consequently the optical thickness of the layer is increased. When the microcavity sensor was exposed to water (with refractive index of 1.3326) and to humic acid (with refractive index of 1.3541), the reflectance spectra promptly shifted towards longer wavelengths by about 39.2 nm and 46.5 nm, respectively.
After analyzing the resonant wavelength shift in the reflectance spectra of microcavity sensor in various conditions, we performed the wavelength shift measurements for the determination of atrazine pesticide in water and HA during their exposure to different concentrations (2.15–2.15 × 10⁶ pg ml−1). It is remarkable that the sensor response depends mainly on two physical factors: the refractive index of the atrazine solution (concentration of atrzine) and its capability of filling the PS pores. The concentration of atrazine in the solution is determined by the wavelength peak shift of the sensor, and the capability of filling the pores is tested by the repetition of measurement values. As shown by experimental results, the resonant peak shift in the reflectance spectra of 1D-PSMC structures for different atrazine concentrations in water from 2.15 to 2.15 × 10⁶ pg ml−1 is of 21.1 nm, but the sensor responses are non-linear in a large range of atrazine concentration. Figure 9 presents the response curve of the sensor to atrazine in water with concentration from 2.15 to 2.15 × 10⁶ pg ml−1. The wavelength shift is only linearly increased in the very low concentration of atrazine (from 2.15 to 21.5 pg ml−1) in our measurement.

Figure 9. Response curve of nano-porous silicon microcavity sensor to atrazine.
Download figure:
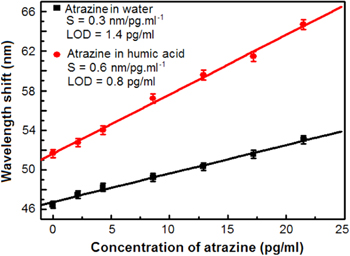
Standard image High-resolution imageTable 3 presents the measurement results of resonant wavelength shift of sensor wetted by atrazine solutions with low pesticide concentrations. The resonant wavelength of sensor shifted on 6.7 nm and 12.3 nm when the concentration of atrazine changed from 2.15 to 21.5 pg ml−1 in water and in humic acid, respectively. It is an important factor for sensor applications that wavelength shift versus atrazine concentration in very low range is linear. Figure 10 shows a linear relation between the different concentrations of atrazine in the very low concentration range from 2.15 to 21.5 pg ml−1 and the resonant peak wavelength shift. In figure 10, each experimental point was the average value of five independent measurements, with the accuracy representing the standard deviation. We could calculate the sensitivity of the sensor as the slope of the linear curve interpolating the experimental points.
Table 3. Resonant cavity peak shift in the reflectance spectra by the different atrazine concentrations.
| Wavelength shift (nm) | ||
|---|---|---|
| Atrazine concentration (pg ml−1) | Atrazine in water | Atrazine in humic acid |
| 2.15 | 40.5 | 48.3 |
| 4.3 | 41.6 | 50.1 |
| 8.6 | 43.4 | 55.2 |
| 12.9 | 44.7 | 56.6 |
| 17.2 | 46.3 | 58.9 |
| 21.3 | 47.2 | 60.6 |
Figure 10. Peak shift of PSMC as a function of atrazine concentration in both water and humic acid solutions.
Download figure:
Standard image High-resolution image
Thus, we obtained the sensor sensitivity value of 0.3 and 0.6 nm pg−1 ml−1 for atrazine in water and in humic acid solution, respectively. From these measurement results, we also estimated the limit of detection (LOD), as the ratio between the instrument resolution and sensitivity. LOD numerical value is 1.4 and 0.8 pg ml−1 for atrazine in water and in humic acid solution, respectively. In addition, it was observed that the higher wavelength shift was observed in the case of atrazine in HA, because atrazine with HA contains dissolved organic matter as the component having higher refractive index in comparison with water.
It is remarkable that the sensor fabricated by our method has significant improvement for the determination of pesticide present in water in comparison with previous works (for example with [12] and [21]). It may be caused by different current densities and etching times for preparation of microcavity samples (i.e. difference in the porosity ratio of low- and high-refractive index layers and layer thickness) and by difference of cavity resonant wavelengths (visible versus infrared). In our case, the experiment had been done for several measurements and the results have good repetition. On the other hand, the obtained results were checked by comparison with electrochemical immunoassays [22] with the same method for preparation of low concentration atrazine sample. In addition, it was observed that, after moving the atrazine solution on the sensor surface and washing it with distilled water, the cavity-resonant wavelength in the reflectance spectra promptly returns to its original position. This is a very good quality of these structures, as it is helpful in the development of reversible sensing devices.
4. Conclusion
In conclusion, we successfully built a high sensitivity measurement system for the determination of solvent solutions and pesticide concentration in water by using an optical sensor based on a nano-porous silicon microcavity. We built the basic characteristics of optical sensors by simulation calculations and by experiment based on a series of organic solvents with known refractive indices. Elaborated sensor sensitivity of 200 nm RIU−1 can detect a minimum refractive index change of about 10−3. We used these sensors for determination of ethanol and methanol concentration from 5% to 15% in the commercial gasoline A92. For simultaneous detection of different organic solvents, the sensor response is controlled by temperature of the solution and velocity of the air stream flowing though the solution. We studied the dependence of the wavelength shift on solvent concentration, velocity of the airflow and temperature solution for the solutions of ethanol and acetone with various concentrations and in order to enhance the sensitivity and specificity of the measurement. The dependence of the wavelength shift on concentration is linear and sensor sensitivity increases with temperature of the solution and velocity of the air stream. Solution temperature and air flow velocity determine the equilibrium of partial vapor condensation in the pores and then contain characteristics of specific solvent vapor pressure and liquid refractive index and allow discrimination between ethanol and acetone and determine the concentration. This suggests a possibility for simultaneous determination concentration and type of solvent. The nano-porous silicon microcavity sensor is capable to determine the atrazine pesticide with concentration in the range from 2.15 to 21.5 pg ml−1 with LOD of about 1.4 and 0.8 pg ml−1 for environment of water and humic acid, respectively, which makes it practically useful to measure values less than the maximum allowed concentrations in water for human consumption.
Acknowledgments
This work financially supported by Vietnam Academy of Science and Technology under Project No.VAST03.06/15-16, and partly supported by National Key Laboratory for Electronic Materials and Devices of Institute of Materials Science under Grant No. CSTĐ 03.14. Very useful discussions and encouragement from Nguyen Van Hieu are gratefully acknowledged.