
Abstract
This work describes the preparation of new carboxymethyl guar gum-silver nanocomposite (CMGG/Ag NC) by green synthesis method. For this carboxymethyl guar gum was used as a reducing agent as well as stabilizer. The silver nanoparticles obtained were characterized by field emission scanning electron microscopy (FE-SEM), transmission electron microscopy (TEM), UV–vis spectroscopy, Fourier transform infrared (FTIR) and energy dispersive x-ray analysis (EDX). The average size of the silver nanoparticles was found of ∼6 nm. Thus, the obtained CMGG/AgNPs NC was examined for optical sensing property for detection of ammonia in aqueous medium. The response time and the detection limit of ammonia in aqueous solution were detected at room temperature. It was concluded that in the future, at this room temperature optical ammonia sensor may be used for medical diagnosis and clinically for detecting low ammonia level (up to 1 ppm) in biological samples for various biomedical applications.
Export citation and abstract BibTeX RIS

Original content from this work may be used under the terms of the Creative Commons Attribution 3.0 licence. Any further distribution of this work must maintain attribution to the author(s) and the title of the work, journal citation and DOI.
1. Introduction
Silver nanoparticles (Ag NPs) have been widely used during the past few years in various applications, because of excellent optical, electronic and chemical properties [1–3]. Some of the applications where Ag NPs have been used are biomedicine [4, 5], biosensor [6], and catalysis [7]. But Ag NPs have found tremendous popularity across the world in the field of sensors because of their significant outstanding properties in fluorescence and surface plasmon resonance (SPR). SPR is associated with the coupled oscillation of free electrons on the conduction band accompanying enhanced local electromagnetic field, which is intensely sensitive to surrounding medium conditions. When a nanoparticle is exposed to an electromagnetic wave, the electrons in the particles oscillate at the same frequency as the incident wave. Spectral characteristics of Ag NPs are strongly dependent on their size, shape, inter- particle spacing and environment [8]. Thus, however the change will be in the medium, there will be a similar change in the spectrum of Ag NPs. On the basis of SPR property of Ag NPs, many scientists [9–14] have proposed that gas or liquid sensors may be made.
Fertilizers and refrigeration are the two big systems where ammonia is being used in huge amounts [15]. But ammonia is toxic for human beings, which creates a serious health problem. It has also been the focus of study for environmental agencies and medical researchers. To know the concentration of the ammonia present in gas form, many sensors based on metal-oxide or organic conducting polymer films have been made. All these sensors are very good, but they are unable to find out the concentration of ammonia dissolved in liquid form [16–18]. So in the present study, for the detection of ammonia in solution, spectrophotometric methods based on the change in colour of a reagent in the presence of ammonia have been developed using Ag NPs colloidal solution made in carboxymethyl guar gum (CMGG). Many methods have been used to synthesize Ag NPs, including micro emulsion [19], γ-ray [20], UV-irradiation [21], microwave irradiation [22], and spray pyrolysis [23]. But all these methods are time consuming and of course we need to buy such costly apparatus for these methods. So we have needed such a method which could be fast, reliable, eco-friendly and cost effective. In the present study we have used a green process for synthesis of Ag NPs by using guar gum derivate. Guar gum derivative has been considered a very good stabilizer and reducing agent for the synthesis of the Ag NPs [24]. CMGG is one of the guar gum derivatives. CMGG [25] is an anionic semi-synthetic guar gum derivative. The polysaccharide backbone is similar to guar gum which is a galactomannan. It is prepared by reacting guar gum with sodium monochlorate in the presence of sodium hydroxide. CMGG is a low cost and easily water soluble commercial polysaccharide. Among the guar gum derivatives, CMGG is very important because it covers a wide range of industrial applications, and has a good film forming property [26–28].
In the present work our aim is to develop a green, rapid, and easy method for preparing well-dispersed Ag NPs in natural polymeric media (CMGG) and testing such Ag NPs as a sensor for ammonia in a very little quantity in liquid. The morphologies of Ag-NPs and the mechanism of their formation have been also discussed.
2. Experimental
2.1. Materials
CMGG powder has been obtained from Hariom gum industry, Gujarat, India. It has been used as it is without further purification. Silver nitrate has been purchased from Merck, Germany. All aqueous solutions were made in double-distilled water.
2.2. Synthesis of Ag NPs
Guar gum derivative CMGG was used as the capping and reducing agent for the synthesis of Ag NPs. 2% (w/v) of CMGG powder was dissolved in 10 ml double-distilled water (DDW) with constant stirring. No change in pH has been done. After complete dissolution of CMGG in water, the temperature was raised from 70 to 90 °C. Now 10 ml of 15 mM silver nitrate solution was added drop wise, with continuous stirring for 100 min After the short time addition of silver nitrate, the colour of the medium converts from colourless to a clear brownish colour solution. This confirms the formation of Ag NPs. The flow of reaction was controlled by recording UV–vis absorption for a fixed time interval and examined.
2.3. Characterization of synthesized Ag NPs
Thus obtained Ag NPs size and shape were characterized by field emission scanning electron microscope (NobaNanoSem-450, FEI) and transmission electron microscope (Tecnai, G2-200 KV HRTEM, SEI company, Holland). The formation of the Ag NPs was further confirmed by energy dispersive x-ray analysis (Bruker D8-Advance), Fourier transform infrared (Thermo Scientific Nicolet 380) and ultraviolet (Parkin Elmer Lambda -750) spectrophotometers.
2.4. Sensing study of ammonia detection
25% ammonia solution was used for the sensing property of the Ag NPs. Different variable concentration solutions of ammonia (1–150 ppm) were prepared using DDW, just before the testing of samples.
3. Results and discussion
3.1. Synthesis and characterization of CMGG/Ag NC nanocomposite
From the literature it is known that CMGG has a lot of functional groups, because its backbone is similar to guar gum. It is more viscous than guar gum with a constant amount. So the capping of CMGG on the Ag NPs' surface increases reactivity over simple guar gum. Because of its transparency in colour and no reactivity with Ag there is no change in λmax and intensity values, even after three months. This was supported by the fact that we get no peaks around 335 and 560 nm in the UV region (this shows no presence of aggregation or nanocluster formation, figure 1(a).
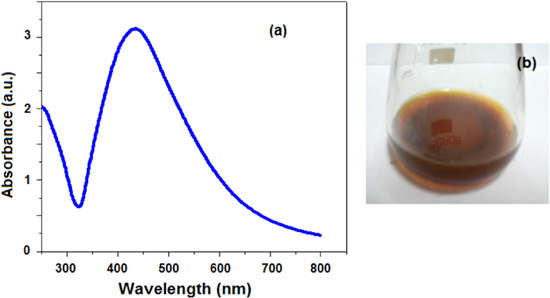
Figure 1. (a) UV–vis spectrum of the CMGG/AgNPs nanocomposite, (b) photograph of CMGG/AgNPs nanocomposite solution.
Download figure:
Standard image High-resolution imageThe normal absorption of Ag NPs lies between the visible ranges (380–450 nm) because of surface plasma resonance of Ag NPs. This is why we obtain yellow-brown colour of Ag NPs in various media [29, 30]. The picture of the Ag NPs solution prepared by our method (mentioned in subsection 2.2) is shown in figure 1(b). The SPR absorbance of all the Ag NPs was observed between 411–450 nm. This confirms the formation of Ag NPs, which was further proved by EDX analysis (figure 2). One more thing was observed from these peak positions—that the particles were not agglomerate but separate to each other, which was also found in TEM images.
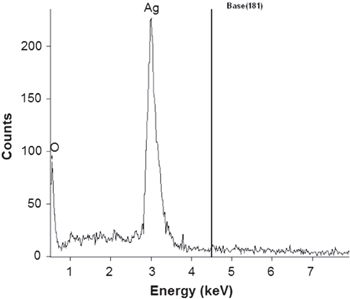
Figure 2. EDX spectrum of CMGG-Ag nanocomposite.
Download figure:
Standard image High-resolution image3.1.1. Effect of reaction time on synthesis of Ag NPs
Synthesis of the Ag NPs was confirmed by the change in colour of the solution, from colourless to yellowish brown. The synthesis of the nanoparticles was investigated through UV–visible spectrophotometer in the time interval of 20, 40, 60, 80, 100 min (figure 3). The spectrum obtained at 100 min shows the absorption maximum as 434 nm with maximum absorbance 3.12. It was found that the absorbance intensity increases as the time increases. From figure 3, we get several important results, (i) when we just add the silver nitrate solution to the CMGG solution, after 20 min we get broadened UV–vis spectrum. This implies that the size of the particles is not equal and fewer particles are formed; (ii) after 80 min, we get the sharper UV–vis spectrum and more brownish solution, this implies that lot of Ag NPs have been formed, which increases the surface plasma intensity in a large label; (iii) after 100 min, we get the sharpest UV-visible spectrum intensity; this clarifies that at this stage most of the silver ions are converted into Ag NPs. At this state the colour of the Ag NPs solution also becomes dark brown. The effect of reaction time on synthesis of NPs results in decrease in wavelength as we increase the time interval of the reaction. This indicates that the particle size of Ag NPs decreases, with the reaction time changing from 0 to 100 min It was also found that much greater amounts of Ag NPs were synthesized at 100 min Thus, this clarifies that small particle size and a large quantity of particles can be obtained by controlling reaction time.
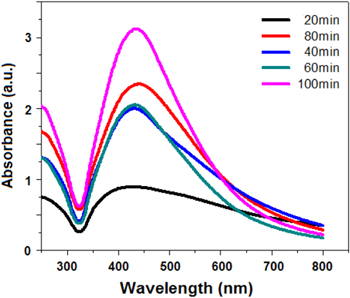
Figure 3. Changes in the absorption spectra of the CMGG/AgNPs NC at various time intervals 20,40, 60, 80, 100 min by using UV–Vis spectrophotometer.
Download figure:
Standard image High-resolution image3.1.2. Effect of silver nitrate concentration
Ag NPs were synthesized by using different concentrations of silver nitrate solution at fixed concentrations of CMGG at the same pH and the same temperature increment from 70–90 °C for 100 min Then all the samples were tested for UV–vis spectra (figure 4). From the spectra it is clear that as we increase the concentration of the silver nitrate solution from 2.5 mM to 20 mM, the peaks of the spectra shift from 450 nm to 425 nm, respectively. This reveals that the particles size is decreasing. In the same pattern the absorbance also increases; this clarifies that more particles are converting from Ag+ to Ag0. One more thing is observed: that all spectra exhibit an absorption band between 400 nm to 500 nm, which is the region for plasma resonance of Ag NPs [31, 32]. From the spectrum it is clear that increase in absorption and decrease in plasma resonance depend upon the concentration of the silver salt. It was also found that a small quantity of CMGG was enough for the synthesizing and stabilizing of the Ag NPs from its different salt concentrations. So variation in the size and shape of the Ag NPs may be controlled by using a different concentration of silver nitrate solution for a fixed quantity of CMGG. Another important characteristic of Ag NPs is their stability. Their stability was tested for about three months. It was seen that the particles were stable even up to three months. From the results it was clear that CMGG is as good a stabilizer as guar gum. This forms a stable adsorption layer on the surface of Ag NPs which makes NPs stable.
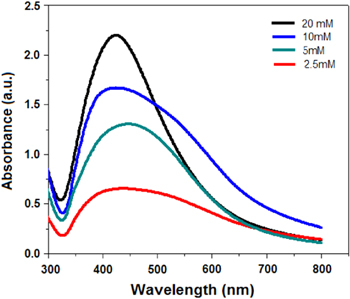
Figure 4. Changes in the absorption spectrum of the CMGG/Ag NC nanocomposite at various silver nitrate concentrations keeping CMGG (2%) and reaction time (100 min) constant.
Download figure:
Standard image High-resolution image3.1.3. FTIR analysis
FTIR spectroscopy analysis of the CMGG/Ag NC was done for detection the interaction between the Ag NPs and CMGG. The CMGG and CMGG/Ag nanocomposites were characterized by FTIR (figure 5). In the spectrum of CMGG the characteristic broad band for O-H group of CMGG appeared at 3438.3 cm−1. A peak around 2928.1 cm−1 was attributed to an asymmetrically stretching vibration of C-H band in alkanes. The asymmetrical and symmetrical vibrations due to moiety were assigned to 1604 cm−1 and 1422.4 cm−1 which may be attributed to carboxymethyl groups into guar gum molecule. Several absorption bands between 813.6–1029.8 cm−1 were attributed to the contribution of various functional groups, such as C-O and C-O-C bandings. All these peaks were found in literature in pure CMGG [33]. In the CMGG/Ag NC we get all the peaks, shifted from its position (in pure CMGG). We obtain peak shift from 3430.9 cm−1 to 3438.3 cm−1 for O-H group, 2918.2 cm−1 to 2928.1 cm−1 for stretching virabation of C-H bands,1599.2 cm−1 and 1416.2 cm−1 to 1604 cm−1 and 1422 cm−1, for carboxymethyl groups into guar gum molecule and 1028.2 cm−1 to 1029.8 cm−1 for C-O and C-O-C bandings. These findings clarify that there has been a strong interaction between CMGG and Ag NPs.
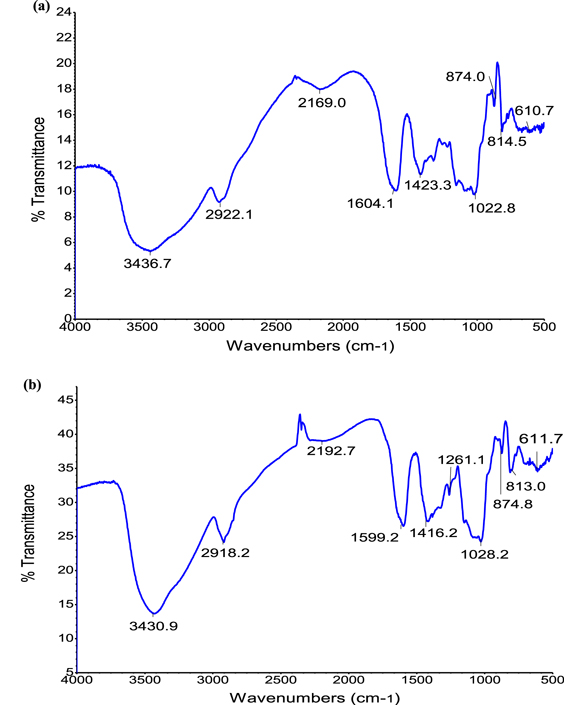
Figure 5. FTIR spectra of (a) pure CMGG and (b) CMGG/Ag NC nanocomposite.
Download figure:
Standard image High-resolution image3.1.4. FESEM studies
The FESEM micrograph of CMGG/Ag NC has been shown in figure 6. From the FESEM images it appears that the shape of the NPs is spherical. This confirms the formation of CMGG/Ag NC.
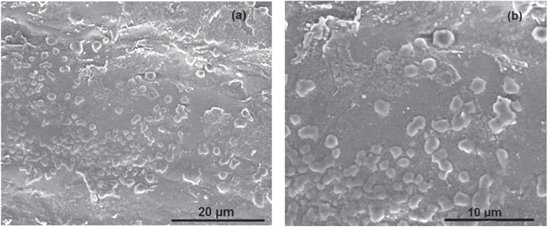
Figure 6. (a) and (b) FESEM images of CMGG/AgNPs nanocomposite.
Download figure:
Standard image High-resolution image3.1.5. TEM studies
Shape and size of the Ag NPs in the CMGG/Ag NC were further confirmed by TEM and HRTEM analysis (figures 7(a), (b) and (c)). It was found that the shape of the particles was spherical. The mean particles size was ∼6 nm, which was calculated from 980 NPs using Image J software (figure 7(d)). The lattice fringes of the NPs were also determined by using HRTEM (figure 7(c)). The lattice d-spacing of the particles was found at 3.0 Å in the (111) plane which is approximately equal the d-spacing in the (111) plane of silver of a face-centred cubic (fcc) structure. TEM images of Ag NPs and the particle size distribution histograms are shown in figures 7(b) and (c), respectively. TEM images and the histogram were taken after 24 h of the synthesis of the Ag NCs. From TEM images it is clear that the shape of the particles is spherical and particles are separate and well stabilized (figure 7(b)). The histogram clearly shows that the Ag NPs have been made in the range of 3 nm to 12 nm. But in TEM image of figure 7(a) some agglomeration has been shown; these clusters or agglomeration might be caused by drying-induced aggregation during the TEM grid preparation [34, 35]. Thus, one more thing is to conclude that CMGG is a good stabilizer for Ag NP synthesis. This also may be because of the some specific structure of the CMGG. As we know that CMGG is an ionic polymer, because of having charged carboxymethyl groups throughout the molecule, these repel each other and therefore favour a highly extended conformation and hence the observed higher viscosity of carboxymethyl guar gum than native guar gum. This higher viscosity gives more adsorbance and stability to Ag NPs than native guar gum.

Figure 7. (a) and (b) TEM images of a spherical Ag NPs prepared by using CMGG as a biomaterial; (c) HRTEM images of Ag NPs in plane (111) showing d-spacing 3.0 Å; (d) particle size distributions of Ag NPs prepared using CMGG as a reducing agent.
Download figure:
Standard image High-resolution image3.2. Reaction mechanism for synthesis of Ag NPs
Mostly Ag NPs are synthesized in two steps. One is the synthesis of silver atom from its salt by using any reducing agent. Second is the polymerization of this silver atom to many atoms, which still does not prepare a cluster in the solution. Pandey has suggested the synthesis of Ag NPs from guar gum by the same mechanism [1]. But one more thing may be possible with CMGG. Because CMGG is an ionic polymer, it has both hydroxyl group as well as carboxymethyl group. Some Ag+ ions may also be getting reduced to Ag0 by getting one electron with the carboxymethyl group. Thus, these two groups might have been the reason for the synthesis of Ag NPs. HRTEM image and TEM image clearly show that Ag NPs have been synthesized in spherical shape, while from the literature we do not get so finely separated Ag NPs images by using guar gum as reducing agent [1]. So it clarifies that carboxymethyl group is also taking part in the reduction process of the silver ion to silver metal. One more thing is observed that the average particle size obtained by using CMGG is ∼6 nm, while we get ∼7 nm size by using guar gum [1]. This shows that carboxymethyl group is also taking part in controlling size.
3.3. Ammonia sensing of CMGG/Ag NC
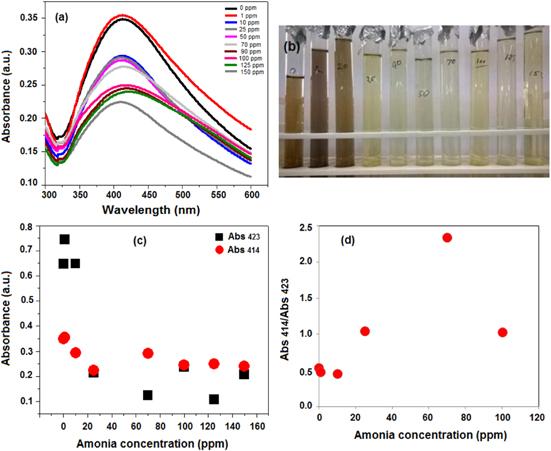
Ammonia sensing property was tested by using the surface plasmon resonance (SPR) property of the Ag NPs in aqueous medium. For this, a UV–vis spectrophotometer was used to obtain the absorbance versus concentration spectra of ammonia solution. The absorbance spectra for different concentrations of ammonia are shown in figure 8(a). For this study freshly prepared Ag NPs colloidal solution was used. The sensing property of the Ag NPs colloidal solution was seen optically, figure 8(a), as well as visually, figure 8(b). Different concentrations of the ammonia solutions of 1, 10, 25, 40, 70, 100, 125 and 150 ppm were made just before the testing of sensing property by using 25% ammonia solution. Then fixed amounts of the colloidal solution of Ag NPs were added to these solutions, respectively. Within 2–4 s we observe that the colour of the solution changes from yellowish brown to dark yellow (figure 8(b)). It was also found that the SPR peak was also shifted from 430 nm to 420 nm on increasing the concentration from 1 ppm to 150 ppm of ammonia solution, respectively. This shifting may be due to the change in inter-particle distance and the dielectric constant of the surrounding media [36]. It was also found from figure 8(a) that as we go for increasing the concentration of the ammonia solution, the absorbance intensity of the peaks decreases. Thus, if we get the absorbance of any unknown solution then the concentration of the ammonia can be detected. Change in two different wavelengths as a function of ammonia concentration is shown in figure 8(c). To know more appropriate sensing property of the Ag NPs, a correlation graph was also plotted between two different absorbance ratios (Abs 414/Abs 423) versus ammonia concentration (figure 8(d)). It was found that the absorbance ratio was linear up to 70 ppm concentration of ammonia solution. The correlation factor R2 value was found to be 0.9723, which is very near to 1 and good enough for using as a sensor, as reported by other researchers.
Figure 8. (a) Variable changes in the UV-Vis absorption plot of CMGG/Ag NC colloidal solution as a function of change in ammonia concentration; (b) visual change in the colour of CMGG/Ag NC colloidal solution as a function of change in ammonia concentration; (c) variation of the SPR peak absorbance for two different wavelengths (Abs423 and Abs 414) and (d) a dot diagram of the absorbance peak (Abs423/Abs414) for CMGG/Ag NC colloidal solution as a function of ammonia concentration, showing it continues increasing up to 70 ppm.
Download figure:
Standard image High-resolution image
4. Conclusions
We have successfully synthesized Ag NPs from silver nitrate solution by using guar gum derivative carboxymethyl guar gum through green synthesis processes. CMGG is a good stabilizer and reducing agent for the synthesis of Ag NPs from its salt silver nitrate. A small quantity of CMGG is sufficient to reduce the silver nitrate to Ag NPs. The amount of Ag NPs depends on the concentration of silver nitration solution and reaction time too. The size of the Ag NPs was found in the range of 3 nm to 12 nm. The SEM and TEM images confirm the formation of CMGG/Ag nanocomposite. The FTIR also supports interaction between CMGG and Ag NPs. CMGG/Ag nanocomposite was found to be good for liquid ammonia sensing property up to 1 ppm within a few seconds. On the basis of these findings a liquid ammonia sensor may be prepared in future, for different clinical and medical diagnosis.
Acknowledgement
The authors are grateful to the institute for proving fellowship to DKV and thank Advanced Instrument centre faculty, DTU for providing characteristic facilities.