
Abstract
A novel eco-friendly effort has been made for the synthesis of cadmium sulfide (CdS) nanoparticles using bacterial biomass. Although some articles have been reported on CdS nanoparticles synthesis by bacteria, here we have synthesized CdS nanoparticles using non-pathogenic bacteria Bacillus licheniformis MTCC 9555. UV-Vis spectroscopy was carried out to confirm the formation of CdS nanoparticles; the peak occurring at 368 nm gives the indication of synthesis of CdS nanoparticles. The size and morphology of the synthesized CdS nanoparticles were analyzed by transmission electron microscopy (TEM) and the nanoparticles are found to have a narrow size of 5.1 ± 0.5 nm with spherical morphology. Further, the nanoparticles were examined by energy dispersive x-ray (EDX) spectroscopy to identify the presence of elements and confirmed the existence of Cd and S in single nanoparticles. X-ray diffraction (XRD) analysis exhibited 2θ values corresponding to CdS nanocrystals. Fourier transform infrared spectroscopy (FTIR) provides the evidence for the presence of proteins as possible biomolecules responsible for the stabilization of the synthesized CdS nanoparticles.
Export citation and abstract BibTeX RIS

Original content from this work may be used under the terms of the Creative Commons Attribution 3.0 licence. Any further distribution of this work must maintain attribution to the author(s) and the title of the work, journal citation and DOI.
1. Introduction
In recent years, the biosynthesis of semiconducting nanoparticles such as cadmium sulfide (CdS) nanoparticles have acquired considerable interest due to their potential application in the field of solar cells, biosensors and fluorescent probe for medical purposes [1–4]. As physiochemical and optoelectronics properties of nanomaterials are size dependent, so researchers have adapted many different methods for synthesis of semiconductor nanoparticles of different sizes by means of microwave irradiation, chemical methods, hydrothermal micro-emulsion, sol–gel and photoetching, which mainly involve the use of large setup and huge cost [5–10]. In order to overcome this, researchers are switching towards biological methods that involve the use of microorganisms and plant extracts for synthesis of various metal/semiconductor nanoparticles [11–13].
The synthesis of inorganic materials such as amorphous silica (diatoms), magnetite (magnetotactic bacteria), gypsum, calcium carbonate layers (S-layer bacteria) and minerals such as calcite into functional superstructures is elegantly controlled by the endogenous capability of a living organism to have precise shape, size and crystallinity [14]. Taking the above fact into consideration, researchers from all around the globe have developed many eco-friendly, cost-effective and novel routes for the synthesis of inorganic nanomaterials at ambient laboratory temperature conditions avoiding the use of chemicals by using various microorganisms. Bacterial strains of Rhodopseudomonas palustris, Klebsiella pneumoniae, and fungal stain of Fusarium Sp. and S. pombe, have been reported for the synthesis of cadmium sulfide nanoparticles [5, 15–17].
In this study a novel, efficient, cost effective, simple, reliable and eco-friendly method has been made for synthesis of CdS nanoparticles. Bacillus licheniformis (B. licheniformis) is a non-pathogenic thermophilic bacteria commonly used in protease production for laundry detergent [18, 19]. The biomass of B. licheniformis has been taken as a potential bio-template for synthesis of CdS nanoparticles. An attempt has been made to understand the mechanism of biosynthesis of CdS nanoparticles.
2. Experimental
2.1. Materials and methods
The bacterial strain of B. licheniformis MTCC 9555 was obtained from the Department of Microbiology, College of Life Sciences, Gwalior, India. Cadmium chloride (CdCl2) and sodium sulfide (Na2S) was purchased from Qualigens Fine Chemicals, Mumbai, India. Nutrient broth media was purchased from Hi-media, Mumbai, India. All chemicals were used as received.
2.2. Bacterial culture and biomass extraction
B. licheniformis MTCC 9555 was grown in Erlenmeyer flasks containing essential sterilized nutrient broth media to obtain the biomass for nanoparticles synthesis. The culture was incubated at 37 ± 1 °C temperature with continuous stirring (200 rpm) for 36 h. After completion of incubation period, the grown biomass was extracted by centrifugation at 8000 rpm for 15 mins. The collected bacterial biomass was washed with deionized water 4 times. The extracted biomass was used for synthesis of CdS nanoparticles.
2.3. Biosynthesis of cadmium sulfide nanoparticles using B. licheniformis
Bacterial biomass (0.5 g) of B. licheniformis MTCC 9555 was added into an Erlenmeyer flask containing 45 ml of deionized water and stirring at 200 rpm for 30 mins. Then 0.1 mM of cadmium chloride (CdCl2) was added into it. Subsequently, sodium sulfide (Na2S) solution (0.01 mM) was added into it drop wise. Then the above solution was left for stirring (200 rpm) at 37 ± 1 °C for 48 h and pH was maintained at 8 ± 1. A control sample was also run without bacterial biomass to compare the results. After incubation, the solution was centrifuged to separate the bacterial biomass from the nanoparticles suspension and used further for characterization.
3. Results and discussion
3.1. UV-Vis spectroscopy study
The formation of CdS nanoparticles using bacterial biomass of B. licheniformis MTCC 9555 was determined with the help of a UV-Vis spectrophotometer (UV-1601pc Shimadzu). UV-Vis spectroscopy reveals a strong absorption peak at 368 nm corresponding to the formation of CdS nanoparticles (figure 1). Further, the band gap of synthesized nanoparticles was calculated by using the equation

where h is Planck's constant, c is speed of light and λ is cutoff wavelength (475 nm).

Figure 1. UV–Vis spectra of synthesized CdS nanoparticles by B. licheniformis MTCC 9555 showing peak at 368 nm.
Download figure:
Standard image High-resolution imageThe band gap of synthesized nanoparticles was found to be 2.61 eV, which is larger than the band gap of bulk CdS (2.42 eV) [20]. This increase in the band gap arises due to shifting of absorption edge towards lower wavelengths (blue shift) as a consequence of quantum size effect. Further, the size of semiconductor CdS nanoparticles is estimated by the Brus equation
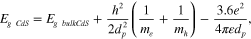
where dp is the diameter of the CdS nanoparticles, EgCdS is the energy band gap of CdS nanoparticles (2.61 eV), EgbulkCdS is the energy band gap of bulk CdS (2.42 eV), e = 1.60 × 10⁻¹⁹ C,  0 = 8.85 × 10⁻¹² C2 Nm−2, = 5.7 0, me
= 1.73 × 10⁻³¹ kg, mh
= 7.29 × 10⁻³¹ kg. According to the Brus equation, the size of the CdS nanoparticles having a band gap of 2.61 eV was estimated to be 5.1 ± 0.5 nm, thus signifying the fact that band gap increases with decrease in particle size.
0 = 8.85 × 10⁻¹² C2 Nm−2, = 5.7 0, me
= 1.73 × 10⁻³¹ kg, mh
= 7.29 × 10⁻³¹ kg. According to the Brus equation, the size of the CdS nanoparticles having a band gap of 2.61 eV was estimated to be 5.1 ± 0.5 nm, thus signifying the fact that band gap increases with decrease in particle size.
3.2. X-ray diffraction (XRD) analysis
XRD (X'Pert PRO PANanalytical x-ray Diffractometer) of synthesized nanoparticles was done by making a thin film of CdS nanoparticles over a glass substrate calcined at 100 °C for the removal of organic substances. The 2θ values were measured over a wide range (3° ≦̸ 2θ ≦̸ 70°), strong peaks occurred at 2θ = 26.7°, 36.6°, 54.9° and 67.2° corresponding to (002), (102), (004) and (203) lattice planes, respectively (figure 2). These sets of lattice planes indicate the hexagonal structure of CdS nanoparticles, which is in good agreement with JCPDS File No.80-0006. Broadening of peaks indicates that the formed particles are in a narrow region. The intensity of the peaks shows that the particles are crystalline in nature.
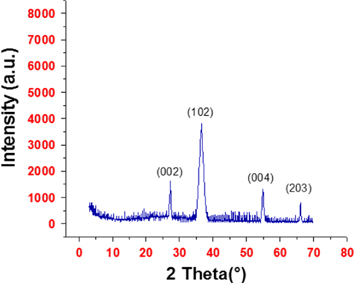
Figure 2. XRD pattern of synthesized CdS nanoparticles using B. licheniformis MTCC 9555.
Download figure:
Standard image High-resolution image3.3. Transmission electron microscopy (TEM) analysis
Drop coated film of CdS nanoparticles was prepared onto the carbon coated copper grid for the analysis of size and morphology of the biosynthesized CdS nanoparticles using TEM (Philips CM-10). The average size of nanoparticles was found to be 5.1 ± 0.5 nm having a spherical morphology (figure 3(a)). Further, the HRTEM shows that the particles have a d-spacing of 2.439 Å (figure 3(b)).
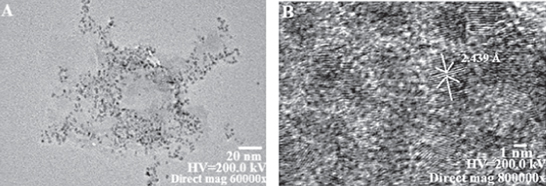
Figure 3. (a) TEM micrograph of CdS nanoparticles synthesized by B. licheniformis MTCC 9555 scanned at 60 000X magnification. (b) HRTEM of synthesized CdS nanoparticles showing (d102 spacing 2.439 Å).
Download figure:
Standard image High-resolution image3.4. Energy dispersive spectra analysis
Energy dispersive x-ray (EDX) spectroscopy was used to analyze the elements present in the sample. EDX (Sigma) analysis shows the peaks of the elemental signal of Cd and S from the emission of the energies of these elements which are being displayed in the spectrum plotted between x-ray counts and energy (keV) and the additional two peaks of Cu are obtained due to the copper grid used for the sampling (figure 4).
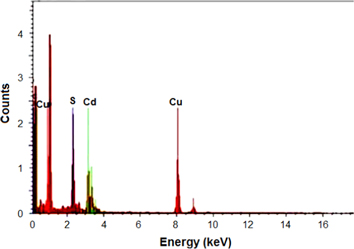
Figure 4. EDX analysis of biosynthesized CdS nanoparticles.
Download figure:
Standard image High-resolution image3.5. Fourier transform infrared spectroscopy analysis
The synthesized nanoparticles were analyzed by Fourier transform infrared (FTIR) spectroscopy (Perkin-Elmer) to determine the possible biomolecules involved in the biosynthesis of nanoparticles (figure 5). An absorbance band of peaks occurring from 3929.00 − 3412.08 cm−1 corresponds to the –OH stretching with the presence of –NH (amide) group which shows the presence of protein/enzyme in the sample. Another peak was also obtained at 2121.70 cm−1 which can be assigned to the stretching of C≡⃥C bond. An absorbance peak occurring at 1641.42 cm−1 and 1560.62 cm−1 corresponds to amide I and amide II adsorption of proteins molecule, respectively. Three peaks occurring at 1462.04 cm−1, 1429.25 cm−1, 1365.60 cm−1 correspond to the bending of –CH group. A single peak at 1230.58 cm−1 corresponds to the C-O stretch of ester. A single peak at 1072.42 cm−1 corresponds to the C-O stretch of ether. Two peaks obtained at 711.73 cm−1 and 619.15 cm−1 can be assigned to the stretching of C-Cl bond. The absorbance band occurring at 572.86 cm−1 and 505.35 cm−1 can be assigned to the stretching of the C-Br bond. The absorbance band occurring from 499.56–374.19 cm−1 can be assigned to the stretching of C-I bond. Earlier, it was reported that amine group helps in the binding of proteins with the CdS nanoparticles [21]. Thus, from this we can conclude that protein released by the bacterial biomass is mainly responsible for the stabilization of CdS nanoparticles.
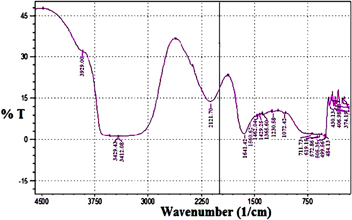
Figure 5. FTIR spectra of synthesized CdS nanoparticles using B. licheniformis MTCC 9555.
Download figure:
Standard image High-resolution image3.6. Mechanism of biosynthesis of nanoparticles
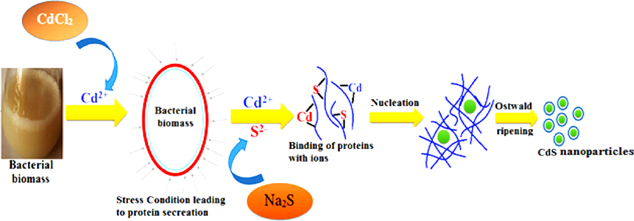
A plausible mechanism has been made to understand the synthesis of CdS nanoparticles (figure 6). At the initial phase of the reaction, CdCl2 dissociates into Cd2+ and accumulates around the bacterial membrane because of the negative potential of the bacterial membrane [22]. Cd2+ being a heavy metal ion creates stress conditions for bacteria, thus leading bacterial biomass to initiate a defense mechanism [23, 24]. This leads bacteria to secrete certain enzymes/proteins in order to detoxify the metal ions that created the metal stress condition [25]. The secreted protein by bacterial biomass binds up with Cd2+. Subsequently, Na2S being added dissociates into S2− in the solution and it also binds with the protein. The CdS nuclei then grow following the process of Ostwald ripening [26] leading to the formation of CdS nanoparticles. Thus, protein secreted in this process becomes incorporated as it serves a capping layer for synthesis of CdS nanoparticles. Further, the detailed mechanism of biosynthesis of CdS nanoparticles is under study.
Figure 6. Potential biosynthesis mechanism of CdS nanoparticles.
Download figure:
Standard image High-resolution image
4. Conclusion
The present work demonstrates an eco-friendly and proficient approach for biosynthesis of CdS nanoparticles at ambient laboratory condition using bacterial stain of B. licheniformis MTCC 9555. The synthesize nanoparticles were characterized using UV-Vis spectroscopy, XRD, TEM, EDX and FTIR. Biosynthesized nanoparticles are found to have an average size of 5.1 ± 0.5 nm with spherical morphology. The calculated band gap of CdS nanoparticles was found to be 2.618 eV. The plausible synthesis mechanism has been described which is mainly focused on negative potential membrane based stress adaptive activity. It is found that the B. licheniformis MTCC 9555 is a potential candidate for biosynthesis of CdS nanoparticles in terms of dispersity, morphology and band gap.
Acknowledgments
The authors are grateful to Dr R P Singh, Adviser, AINT and Dr Ashok K Chauhan, Founder, President, Amity University (Noida, India) for their encouragement and providing excellent facilities for the above work. ASB would like to thank Mr Nishant Kumar and Mr Rohit Kumar Gupta for their help in carrying out the experiments.