
Abstract
In this work silica (SiO2) and sulfonic acid-functionalized silica (sul-SiO2) were synthesized by sol–gel method from tetraethoxysilane (TEOS) and 3-mercatopropyltrimethoxysilane (MPTMS) with various ratios between them. The synthesized materials were characterized by x-ray diffraction (XRD) for crystalline structure, Brunauer–Emmet–Teller (BET) specific surface area analysis, transmission electronic microscopy (TEM) and dynamic light scattering (DLS) for particle size analysis, and ion exchange capacity (IEC) for determining sulfur content in Sul-SiO2 materials. The initial results showed that the average particle size of amorphous SiO2 and Sul-SiO2 at different TEOS: MPTMS ratios are in narrow distribution with average diameter about 20–30 nm. The particle size of Sul-SiO2 is almost unaffected by the content of MPTMS while IEC depends strongly on it. Composite membranes of 60 μm thickness were successfully prepared from blending of poly(vinylidene fluoride) (PVDF) and synthesized amorphous SiO2. It was shown that the latter may be used as a reinforced phase for composite membrane electrolytes based on PVDF.
Export citation and abstract BibTeX RIS

Content from this work may be used under the terms of the Creative Commons Attribution 3.0 licence. Any further distribution of this work must maintain attribution to the author(s) and the title of the work, journal citation and DOI.
1. Introduction
With the increasing concern for environmental protection and the reduction of fossil fuel, there is a need to find cleaner and greener energy sources. Over the last two decades, there has been a significant increase of research and development in the fuel cell for its ability to convert chemical energy of fuel into electricity without causing much pollution. Fuel cells can be separated into several categories including alkaline, polymer electrolyte membrane (PEM), phosphoric acid, molten carbonate and solid oxide systems. Each of them has its own potential in different applications.
Polymer electrolyte membrane fuel cell (PEMFC) has potential applications in portable devices and automobiles because of its low weight and simple system features. At present, perfluorosulfonic polymers as well as nafion (DuPont) have attracted attention because of outstanding chemical, mechanical and thermal stability and high proton conductivity. Nafion membrane, nevertheless, tends to significantly dehydrate at high temperature or low humidity, leading to low proton conductivity and poor PEMFC performance. One of the strategies is to incorporate inert hygroscopic fillers (silica, titania and zirconia phosphate) into nafion in order to improve the thermal stability and enhance the water retention properties in elevated temperature conditions.
Adopting the direct neat fillers into nafion membrane results not only in low proton conductivities but also impaired mechanical properties because of proton insulation by these inert fillers and poor compatibility between the hygroscopic fillers and nafion. Silica (SiO2) and sulfonic acid-functionalized silica (Sul-SiO2) are materials widely used in catalysis, absorption and chromatography. In proton exchange membrane fuel cell (PEMFC), the composite of Sul-SiO2 particles and nafion polymer should enhance the mechanical properties, water uptake and temperature stability of membrane [1–3]. Sulfonated silica has been demonstrated to have proton conductivity comparable to water saturated nafion. Ganesan and Walcarius [1] found that the direct modification of silica powder is less effective than the sol–gel method because of low loading of thiol group ( ) or sulfonic acid group (
 ) on silica surface, which may be indicated by ion exchange capacity. Therefore, in this work the sol–gel method was chosen to modify silica. We have focused on the fabrication of amorphous silica (A-SiO2) and sulfonic acid functionalized silica. The synthesized amorphous SiO2 was blended with poly(vinylidene fluoride) (PVDF) in order to obtain hydride composites that could be used as a model of nafion/SiO2 composites for further investigation on fuel cell membranes.
2. Experimental
2.1. Synthesis of amorphous silica
Figure 1 shows the preparation process of nano amorphous silica (A-SiO2). First, 0.5 ml tetraethoxysilane (TEOS, Merck) was added in ethanol solution (20 ml) containing tetra-n-butylammonium bromide (TBAB, Merck) and polyvinylpyrrolidone (PVP, 40 000 Mw, Prolabo) dissolved as cationic and non-ionic surfactants, respectively. For the hydrolysis, 2.5 ml of 1 M solution of nitric acid (HNO3) was added drop wise and then stirred vigorously at room temperature. The solution had been kept stirring for 1 h under acidic condition. After that, 10 ml of 1 M ammonium hydroxide (NH4OH) was added into the solution to promote the assembly of the silica–surfactant complex. The resultant sol or gel was dried at 80 °C in air for 24 h and finally calcinated in air at 600 °C for 3 h to remove the organic compounds [2].
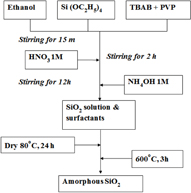
Figure 1. Flowchart of amorphous silica (A-SiO2) synthesis by sol–gel technique.
Download figure:
Standard image High-resolution image2.2. Synthesis of sulfonic acid functionalized silica
The procedure of Sul-SiO2 synthesis [3] is presented in figure 2. Firstly, 3-mercatopropyltrimethoxysilane (MPTMS 98%, Merck) was added to 2-propanol solution (99% Merck). Then, hydrogen peroxide (H2O2) was added to oxidize the thiol ( ) groups of MPTMS to sulfonic acid groups, and the solution was stirred vigorously at 60 °C. After TEOS (98% Merck) was added, the mixture was stirred about 15 min to obtain homogeneous solution. The hydrolysis occurred when NH4OH was added. The mixture was stirred for overnight at 60 °C to become a viscous and transparent solution which then was filtered, washed by hot water and ethanol, and dried at 60 °C in Buchi vacuum chamber for 5 h. The volume ratio of MPTMS:TEOS is expressed by (5 − x):x (x = 1, 2, 3, 4), and the products are coded in reference to n% of Sul-SiO2 (n represents the volume percentage of MPTMS in the precursor solution.

Figure 2. Flowchart of functionalized SiO2 preparation by sol–gel technique.
Download figure:
Standard image High-resolution image2.3. Fabrication PVDF/SiO2 composite
PVDF powder (average molecular weight of 534 000 by Gel Permeation Chromatography), purchased from Sigma Aldrich, was dissolved in dimethyl formamide (DMF, Merck) at room temperature using magnetic stirrer for 3 h until a transparent solution was obtained. In the other beaker amorphous SiO2 was dissolved in DMF at room temperature (stirred for 3 h). Then the solution of amorphous SiO2 in DMF was poured directly into the PVDF solution. After being treated by ultrasonic vibration for 15 min, the mixture was stirred at room temperature for 6 h. The membrane, achieved by casting the resultant solution on a glass substrate, was dried at 80 °C for 2 h. The flow chart of PVDF/SiO2 composite film preparation was shown in the figure 3.

Figure 3. Flowchart of PVDF/SiO2 composite fabrication.
Download figure:
Standard image High-resolution image2.4. Materials characterization
The sample structure was characterized by Fourier transform infrared spectroscopy (FTIR, Bruker Equinox 55, 0.5 cm−1 resolution) and powder x-ray diffraction (XRD, Bruker, D8-Advance x-ray diffractometer, Cu-Kα, λ = 1.5406 Å). The morphology and particle size were analyzed by field-emission scanning electron microscope (FESEM, JEOL, JSM-7401F), transmission electron microscope (TEM, JEOL, JEM-1400) and laser diffraction particle size distribution (DLS, Malvern Zetasizer Nano ZS). The thermal properties of hydride composite membranes were analyzed by differential scanning calorimetry (DSC) using Mettler-Toledo 822e DSC instrument. The specific surface area (SSA) was measured by nitrogen adsorption/desorption on Autosorb1C (Quantachrome Instruments).
Ion-exchange capacity (IEC) was defined as the numbers of sulfonic groups (in moles) in 1 g of dry sul-SiO2. In this method, 100 mg of sul-SiO2 sample were soaked in 25 ml of 1 M KCl aqueous solution and stirred vigorously at room temperature for 24 h. The released H+ was titrated with 5 × 10⁻³ M NaOH solution. The IEC was calculated by equation

where VNaOH, NNaOH and Wdry are volume of NaOH, concentration of NaOH and weight of the solid powder, respectively.
The thickness of PVDF/SiO2 membranes was measured by thickness gauge MITUTOYO, Japan (range 0–10 mm, resolution: 0.01 mm).
3. Results and discussion
3.1. Amorphous silica and sulfonic acid functionalized silica
The FTIR spectrum of A-SiO2 and Sul-SiO2 is shown in figure 4. As we can see, the broad band near 3440 cm−1 corresponds to the  stretching vibration of incomplete silanol group (
 ) condensation as well as remaining absorbed water. The vibration's peaks belonged to the SiO2 groups are assigned to the asymmetric and symmetric stretching modes (observed at 1100 and 808 cm−1) and the bending mode (at 466 cm−1) as a weak band. These results provide an evidence of a successful condensation reaction between Si–OR groups [3].

Figure 4. FTIR spectrum of A-SiO2 sample.
Download figure:
Standard image High-resolution imageThe Raman spectrum in figure 5 shows the intensive band at 1048 cm−1 in sample of sul-SiO2 80%, this band was assigned to the symmetric mode of the sulfo functional (SO3) group of the corresponding sulfonic acid [4].

Figure 5. Raman spectrum of  functionalized sample (Sul-SiO2 80%).
Download figure:
Standard image High-resolution imageX-ray diffraction patterns of pure SiO2 and Sul-SiO2 80% are shown in figure 6. Both XRD patterns have a broad peak between 17° and 30°, centered at 22.5°, typical for the amorphous silica [5].

Figure 6. XRD pattern of (a) amorphous SiO2, (b) Sul-SiO2 80% (MPTMS:TEOS = 4:1).
Download figure:
Standard image High-resolution imageTEM image of dried amorphous SiO2 was shown in figure 7(a). The distribution of average particle diameter in the range 8–23 nm is presented in figure 7(b). In addition, the particle size distribution curve (figure 7(c)) shows that there are three groups of particle size. The large particle size (268 nm) indicates that silica particles tend to agglomerate together during storage. It is well known that nanoparticles have low stability due to their high surface energy [6]. The formation of silica nanoparticles was achieved by the cooperative assembly of anionic silicate with a cationic surfactant and a non-ionic polymer. The tetra-n-butylammonium cations (TBA+) combined with anionic silicate through electrostatic interaction in the basic solution, which caused a decrease in their polarity. PVP, as a non-ionic surfactant, was used to protect the silica-TBA particles due to a weak interaction between ionic and non-ionic hydrophilic groups [7]. The synthesis procedure of silica nanoparticles cannot be used for silica modification with MPTMS because of the latter's high viscosity which would cause problems in filtration and removal of organic surfactants from the final product. Unlike the process of A-SiO2, we cannot remove surfactants of Sul-SiO2 by calcination at high temperature since the organic chains of modified silica, particularly,  or
or  chains, may be burnt.
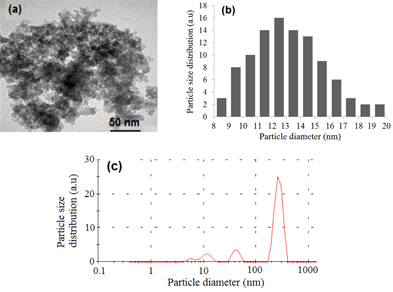
Figure 7. (a) TEM image of amorphous SiO2, (b) SiO2 particles size distribution from TEM image, (c) SiO2 particle size distribution curves from laser diffusion of Malvern Zetasizer.
Download figure:
Standard image High-resolution imageAn SEM image (figure 8(a)) shows the morphology of Sul-SiO2 powder. From TEM images of Sul-SiO2 80% (figures 8(b) and 8(c)), we can see that the average particle diameter of this sample was in the range of 20–30 nm. The Sul-SiO2 particles are normally larger than A-SiO2 because the former were synthesized without surfactants.

Figure 8. (a) SEM image of Sul-SiO2 80%; (b) and (c) TEM images of Sul-SiO2 80%.
Download figure:
Standard image High-resolution imageWith increasing MPTMS concentration from 20 to 80% in the original solution, the specific surface area of Sul-SiO2 samples remained unchanged, around 300 m2 g−1. We observed that the specific surface area (SSA) of A-SiO2 is 411.6 m2 g−1, higher than SSA of all the Sul-SiO2 samples (figure 9). This may be explained by the presence of organic groups in the materials [8].

Figure 9. Specific surface area of A-SiO2 and Sul-SiO2 samples.
Download figure:
Standard image High-resolution imageThe ion exchange capacity of the materials tends to increase with the increasing MPTMS content from 20 to 80% in the initial solution (figure 10), but the IEC of Sul-SiO2 was reduced when no TEOS was added to the starting solution, which composed of MPTMS, 2-propanol and H2O2.

Figure 10. Variation IEC of Sul-SiO2 versus the relative molar percentage of MPTMS (n%) in the initial solution.
Download figure:
Standard image High-resolution image3.2. Composite PVDF/SiO2
As shown in figure 11 and table 1, five points were chosen for the thickness-gauge measurement, and the average membrane thickness was obtained by the mean value. The thickness of PVDF is about 60 μm (the commercial DuPont proton exchange membrane nafion is 50 μm of thickness).

Figure 11. Thin films of (a) pristine PVDF and (b) composite 5% SiO2 content.
Download figure:
Standard image High-resolution imageTable 1. Thickness values of PVDF thin film.
| Points | Thickness (μm) |
|---|---|
| 1 | 60.5 |
| 2 | 60.0 |
| 3 | 60.0 |
| 4 | 60.0 |
| 5 | 60.0 |
| Average | 60.1 ± 0.2 |
The melting point and the crystallization degree of the pristine PVDF and PVDF/SiO2 composites were measured by DSC, performed at 10 °C min–1 heating rate under nitrogen gas atmosphere. The crystallization (Xc) of PVDF and PVDF/SiO2 composites was calculated from equation

where ΔHm is the experimental heat of fusion and W is the PVDF content in the PVDF/SiO2 composites. A value of 90.4 J g−1 was used for Δ Hm0 of PVDF crystallized under large super-cooling conditions, which is essential for the formation of α crystals [9].
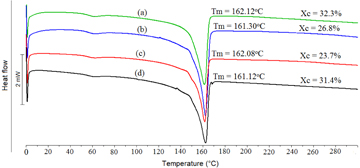
The crystalline degree of PVDF decreased from 32.3 to 23.7% with the addition of 3 wt% SiO2, however, increases to 31.4% when amorphous SiO2 content reaches 5%.
DSC thermograms for PVDF and PVDF/SiO2 hybrid composites are shown in figure 12. The PVDF homopolymer has a melting temperature (Tm) of 161 °C, which does not change with the presence of dispersed SiO2. The melting points for the hybrid composites were observed also at around 162 °C. Thus, the addition of SiO2 particles up to 5 wt% inconsiderably affects the thermal properties of PVDF film.
Figure 12. DSC thermograms of (a) pristine PVDF, (b) PVDF/SiO2 with 1% SiO2, (c) PVDF/SiO2 with 3% SiO2 and (d) PVDF/SiO2 with 5% SiO2.
Download figure:
Standard image High-resolution image
4. Conclusions
Amorphous silica nanoparticles were successfully prepared by sol–gel method from TEOS with average diameter below 23 nm. In the silica modification process, Sul-SiO2 samples were synthesized with various proportions of MPTMS and TEOS in initial solutions. The average particles size of Sul-SiO2 80% is around 20–30 nm. The variation of MPTMS concentration in the studied range (20–80%) inconsiderably affects the specific surface area of obtained Sul-SiO2 samples. The rising of IEC values of Sul-SiO2 samples with the increasing MPTMS concentration in initial solution shows that the modification of silica by sol–gel method is effective. In addition, PVDF/SiO2 composite membranes with thickness of 60 μm were successfully fabricated. The presence of 5% SiO2 did not affect significantly the thermal properties of PVDF membrane. Thus, both amorphous silica and functionalized silica can be used as a reinforced phase for polymer electrolyte membranes based on PVDF.
Acknowledgments
This work was supported by VNU-HCM through the grant for B2011–18–01TĐ project and partly financed by Vietnam Ministry of Science and Technology under the NCCB-DHUD.2011/G11 project.