
Abstract
Nanoparticles of ZrO2:Er3+, Yb3+ fabricated by a soft template method combined with microwave heating under high pressures were reported for the first time. Nano ZrO2:Er3+, Yb3+ in concentrations of 0.1–15 mol% have been fabricated in the presence of soft template agent diethylene glycol or polyethylene glycol in a microwave reactor at pressures up to 55 atm. The average size of the as-synthesized nanoparticles was found to be 5–13 nm. The upconversion luminescence of the ZrO2:Er3+, Yb3+ was found in the red region of 630–710 nm and in the green region of 510–570 nm, with excitation by an infrared diode laser at the wavelengths of 830 and 940 nm, respectively. The change in content ratio between monoclinic and tetragonal phases when the annealing temperature increases from 600 to 1200 °C was investigated. The tetragonal phase content decreases and disappears for the samples annealed at 1200 °C. The increase in the content of the monoclinic phase is suggested to be a main reason for the increase in the upconversion luminescent intensity of nano ZrO2:Er3+, Yb3+.
Export citation and abstract BibTeX RIS

Content from this work may be used under the terms of the Creative Commons Attribution-NonCommercial-ShareAlike 3.0 licence. Any further distribution of this work must maintain attribution to the author(s) and the title of the work, journal citation and DOI.
1. Introduction
Possessing excellent physico-chemical properties, including low optical propagation loss, large refractive index and especially low phonon energy, ZrO 2 ceramic material can be used in optoelectronic and biomedical applications [1–5]. According to a recent study, the Er 3+-doped ZrO 2 nanopowder has shown an interesting property of visible upconversion luminescence under infrared excitation and therefore it has potential for a new application in the fluorescent detection of biomedical molecules [6–8].
A number of synthesis methods have been reported to fabricate the nanomaterials: hydrothermal, co-precipitation, template assisted (hard and soft templates) [6–9], sol–gel [4, 5] and others incorporated with different techniques (microwave, ultrasonic vibration, high and low pressure) [1, 3, 6, 7]. The synthesized nanoparticles were used as starting materials for the next doping step with rare earth ions such as Er 3+ or Yb 3+. Recently, there have also been a number of reports on the synthesis of rare earth oxides using a soft template of polymers and organic compounds [9, 10], and the synthesis of ZrO 2 nanopowder using a microwave method under high pressure [1, 6, 8].
In our work, we have developed the soft template method incorporated with microwave heating under high pressure to fabricate (Er 3+, Yb 3+)-doped and (Er 3+/Yb 3+) co-doped ZrO 2 nanopowder. The results from the synthesis, characterization and upconversion luminescence properties of the studied nanopowder are reported. In addition, these results allow us to discuss the emission mechanisms of the upconversion luminescence in the visible region under infrared excitation.
2. Experiment
ZrOCl 2·8H 2 O, ErCl 3·6H 2 O, YbCl 3·6H 2 O, diethylene glycol (DEG), polyethylene glycol (PEG) and NaOH, all with a high purity from 99.9 to 99.99%, purchased from Merck, were used as the starting chemicals. After adding a soft template agent to precursor solution at room temperature, the synthesis took place in the Eretec reaction system.
The experimental procedure can be divided in two main steps. Firstly, the solution containing the rare earth ions (Er 3+, Yb 3+) or (Er 3+/Yb 3+) and that of ZrOCl 2 0.5 M were carefully mixed together with a magnetic stirrer until a high homogeneous dispersion of the mixture was obtained. The DEG or PEG was added to the obtained mixture and was then stirred regularly and continuously for 1 h. Finally, the NaOH 10% was added drop-wise to the stirring solution until a pH of 8–12 was reached and a homogeneous suspension (sol) was obtained.
In the second step, the above prepared sol at room temperature was transferred to a sealed Teflon container and heated in the high pressure microwave system. The microwave reactor in the high pressure system Fetec (Poland) was used for the synthesis of pure and RE 3+-doped ZrO 2 nanoparticles. At a temperature of about 315 °C and pressure of 55 atm, the reaction was carried out for 35 min. and subsequently cooled down by water. The obtained products were washed thoroughly by deionized water and isopropanol, and then dried at 70 °C. After that, the prepared samples were annealed at temperatures ranging from 600 to 1200 °C. The rate of the annealing temperature was maintained at 5 °C min, and the annealing time of 1 h was chosen. The morphology of the nanocrystals was estimated by transmission electron microscopy (TEM, JEM-2010, JEOL), their crystalline phase structure was determined by using an x-ray diffractometer (XRD, SIEMENS D5000), and their material density and specific surface area (BET) were measured with a GEMINI 2360 system (USA) at the Institute of High Pressure Physics (IHPP), Warsaw, Poland. The measurements on luminescence spectra were carried out on a fast and miniature CCD spectrophotometer (OceanOptics) with sensitivity from 340 to 1000 nm at the Institute of Low Temperature and Structure Research (ILTSR), Wroclaw, Poland, using an infrared laser exciting source at a wavelength of 830 nm and Microspec 2300i spectrometer at the Institute of Materials Science (VAST, Hanoi), using an infrared laser exciting source at wavelengths of 830 and 940 nm, equipped with a CCD camera with sensitivity from 300 to 1000 nm.
3. Results and discussions
3.1. Morphology and crystal structure of ZrO 2:RE 3+ nanopowder
Figure 1 shows the TEM images of as-synthesized ZrO 2 nanopowder doped with 1 mol % Er 3+. One can see that the particles of our samples are small (5–13 nm), with a narrow size distribution and a high uniformity. This result also coincides with those from the calculation based on results of structural analysis (XRD) and specific surface area. The uniformity in size of these particles may be due to the presence of a polymer soft template in the reaction solution. This uniformity was also found in our previous work on the synthesis of nanocapsules of ZrO 2 using a soft template agent with PEG 4000 [7, 9, 10]. While the low pressure and soft template method have produced a powder in nanorod form [9], this high pressure assisted soft template method provides us with spherical particles.
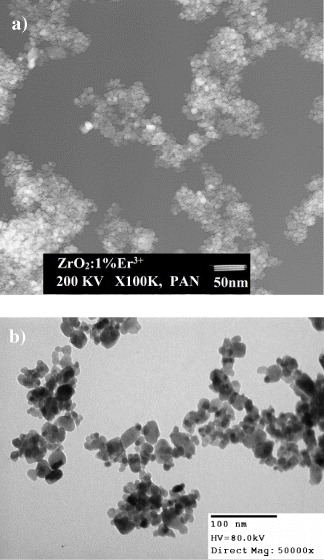
Figure 1 (a) The TEM images of ZrO 2:1 mol% Er 3+ dried at 70 °C in air. (b) The TEM images of ZrO 2:1 mol% Er 3+ annealing at 600 °C, with a heating rate of 5 °C /min -1 for 1 h.
Figure 2 shows the x-ray diffraction patterns of the samples from undoped ZrO 2 and ZrO 2:Er 3+ (figure 2a) and ZrO 2:Yb 3+ (figure 2(b)) with various concentrations of dopants. The results show that the concentration of doped ions strongly affected the formation of crystal structures of the samples. For the samples without the rare earth ions (Er 3+, Yb 3+) or with a relatively low concentration of them (below 5 mol%), the nanoparticles crystallized mainly in tetragonal (T) phase and only a small fraction of monoclinic (M) phase was found. The crystalline phase ratio of M to T decreased with an increase in concentration of doping rare earth ions. By comparing the intensity of the diffraction peaks, we can see that the crystallinity of the samples doped with Yb 3+ is greater than that of the samples doped with Er 3+ ions.
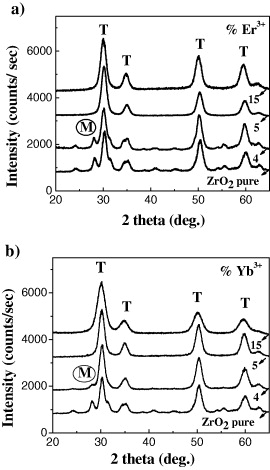
Figure 2 (a) The XRD patterns of ZrO 2 and ZrO 2:Er 3+ nanoparticles with concentrations from 0 to 15 mol%. (b) The XRD patterns of ZrO 2 and ZrO 2:Yb 3+ nanoparticles with concentrations from 0 to 15 mol%.
X-ray powder diffraction diagrams of Er 3+-doped ZrO 2 annealed at various temperatures are shown in figure 3. The results revealed that the ratio between monoclinic and tetragonal phases coexisting in samples increased with annealing temperature ranging from 600 to 1200°C for 1 h. The samples with only one crystalline phase of monoclinic were obtained with an annealing temperature of 1200°C for 2 h. These structural phase analyses showed that, in all doped samples, no impurities were found. It proved that the microwave-assisted soft template method under high pressure allows us to produce doped ZrO 2 nanomaterials with a very high doping concentration.
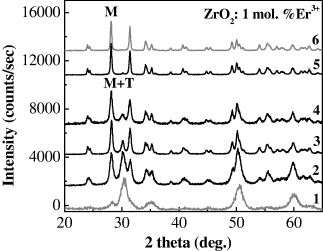
Figure 3 The XRD patterns of ZrO 2:1 mol% Er 3+70 °C—24 h; (2) 600 °C—1 h; (3) 800 °C—1 h; (4) 1000 °C—1 h; (5) 1200 °C—1 h; (6) 1200 °C—2 h.
Based on the width at half maximum intensity of the first diffraction peak (2θ≈30.2°) in the x-ray diffraction diagrams, the average size of crystals (grain size) was calculated by applying the Scherrer formula [11]. The grain size, d, is related to the x-ray line broadening by Scherrer's formula

where d (m) is the mean crystallite size, λ(m) is the x-ray wavelength, β (rad) is the full width at half-maximum (FWHM) of the [111] reflection (2θ ≈ 30.2°) and θ(°) is the diffraction angle.
The reflection broadening due to the diffractometer setup was eliminated from the β s value by using a FWHM of a microcrystalline ZrO 2 sample, and β r as a reference:
We can see that the particle size decreases from 13 to 5 nm with increasing doping RE ion concentration (figure 4).
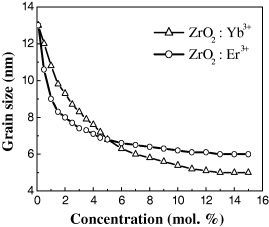
Figure 4 ZrO 2:Er 3+, Yb 3+ grain size is calculated by Scherrer's formula.
The calculation results from Scherrer's formula show the effect of the concentration of the doping rare earth ions on the average size of the nanocrystals. It is suggested that under the same reaction condition the greater doping concentration, the more energy is required to crystallize and, consequently, the less energy is provided to grow the nanoparticles.
Nanopowders produced by high pressure assisted soft template methods have a low density. The BET results indicated that the largest specific surface area ranges from 90 to 180 m 2 g -1. We have also compared the average grain sizes of nanoparticles (ϕ) obtained from XRD data [7, 10] with those calculated from the measurements of density and specific surface area [12] by using the formula

where ρ is the density and S is the specific surface area. The average grain size of the pure, (Er 3+, Yb 3+)-doped and (Er 3+/Yb 3+)-co-doped ZrO 2 nanopowders calculated from specific surface areas is the same range in comparison with that obtained from XRD data [7, 10]. This calculation of the average size of nanocrystals shows the same dependence of the average crystal size on the doping concentration of rare earth ions (figure 5), compared with the results from TEM images and Scherrer methods.
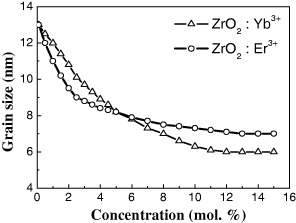
Figure 5 Grain size is calculated from BET of ZrO 2:Er 3+, Yb 3+.
3.2. Upconversion luminescence properties
Figure 6 shows the upconversion luminescence (UCL) spectrum of ZrO 2 doped with Er 3+ of 1 mol%, and annealed at 1000 °C (a), 600 °C (b) and with a drying step at 70 °C (c). Note that the luminescence intensity of the ZrO 2:1 mol% Er 3+ sample with drying at 70 °C (curve c) has been multiplied by 10 for clarity. The excitation by an infrared laser of 830 nm was used for the luminescence measurements. Here we can see that the heat treatment strongly affected the intensity and upconversion ability of the luminescence process, and the intensity of the green region became stronger than the red one with an infrared laser excitation source of 830 nm.
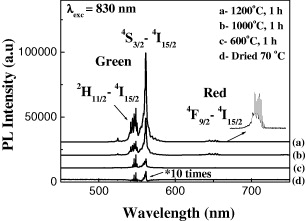
Figure 6 Upconversion luminescence spectra of the ZrO 2:1 mol% Er 3+ under 830 nm excitation.
Our studies of the dependence of the luminescence intensity of ZrO 2 materials doped with RE 3+ on the annealing temperature were implemented in the optimal conditions of 1200 °C and with the increasing temperature of 5 °C min -1. Under these fabrication conditions, the growth of nanocrystals is minimized and the content of the monoclinic crystal phase is increased up to the maximum. As shown in figure 6, the emission of luminescent material is maximized at 1200 °C. This indicates that the increase in monoclinic phase content of nano ZrO 2:Er 3+, Yb 3+ plays a key role on the increase of upconversion luminescence intensity. In addition, the completeness of the decomposition of reactants and by-products, such as DEG hydroxides at high annealing temperatures, increased and, as a result, the luminescence intensity increased significantly.
Figure 7 presents the results of upconversion luminescence of Er 3+-doped ZrO 2 nanopowder annealed at 1200 °C for one hour with a heating speed of 5 °C/min -1 and excited at 940 nm by infrared diode laser.
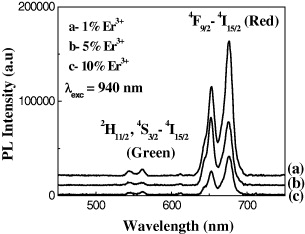
Figure 7 Upconversion luminescence spectra of the ZrO 2:1; 5 and 10 mol% Er 3+ under 940 nm excitation.
The results show that the luminescence peak appeared at the red region for the doping content of Er 3+ between 1 and 10 mol%, and the upconversion reached the maximum at the doping concentration of 1 mol%. As shown in figure 7, the ratio of luminescence intensity at the red band of ZrO 2:1% Er 3+ /ZrO 2:5% Er 3+ /ZrO 2:10% Er 3+ samples is about 3.8/2.8/1. The change in intensity was clearly observed by looking at the change in red colour at the sample measured under laser excitation at 940 nm. Luminescence quenching also did not take place until the concentration of the doping activator Er 3+ increased to 10 mol%. Thus, compared with other preparation methods, the applied preparation procedure provides a higher threshold of luminescence quenching concentration of the dopant.
The curves in figure 8 are the upconversion luminescence spectra of ZrO 2 nanopower co-doped with 1 mol% Er 3+ and 18 mol% Yb 3+ (a) with the same treatment conditions as above. Here we have found that in the red region (640–675 nm), the integral intensities of this sample have been increased by 2.3, compared with that of the ZrO 2:1 mol% Er 3+ sample, whereas they almost disappeared in the green region.
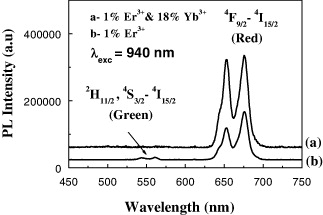
Figure 8 Upconversion luminescence spectra of the ZrO 2:1 mol% Er 3+ and ZrO 2:1 mol% Er 3+ and 18 mol% Yb 3+ under 940 nm excitation.
From the measurement of upconversion luminescence, the emission process of ZrO 2:Er 3+ and ZrO 2:(Er 3+/Yb 3+) can be explained as follows. As a result of excitation at the wavelengths of 830 and 940 nm, the upconversion effect was observed. In the spectra, some peaks in the green region (540–565 nm) are assigned to the emissive transition from 2 H 11/2, 4 S 3/2 to 4 I 15/2 and all other peaks in the red region (640–680 nm) correspond to the 4 F 9/2–4 I 15/2 transition (figure 9).
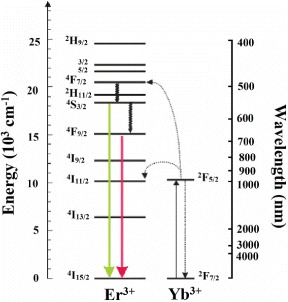
Figure 9 Schematic diagram of upconversion luminescence of ZrO 2:Er 3+, Yb 3+.
The excitation at wavelength of 830 nm gave mainly green emission around 560 nm, whereas with the excitation of 940 nm we obtained nearly all of the peaks in the red region with the two strongest emission bands of 653 and 675 nm. On the other hand, in the presence of the co-activator Yb 3+ ion, the ZrO 2:Er 3+/Yb 3+ exhibited strong emission in the red spectral region as a result of excitation at 940 nm. This effect may be explained as follows. Under the excitation of wavelength 940 nm, the Yb 3+ ion jumped from the ground state 2 F 7/2 to 2 F 5/2, and from this state it interacted with the Er 3+ ion at correlative energy level 4 I 9/2. Then it relaxed to the transient level of 4 F 9/2 and emitted the upconversion luminescences with two maxima in the red region. It was therefore difficult for the green emission to take place [14–17].
4. Conclusion
A soft-template method combined with heating by microwave under high pressure was used to prepare rare earth ion (Er 3+ and Yb 3+) doped ZrO 2 nanopowder with an average diameter of about 5–13 nm, high yield and size uniformity. The high doping and co-doping concentration of rare earth ions (Er 3+ and Yb 3+) can be reached, e.g. about 18 mol%.
The tetragonal phase of a ZrO 2:1 mol% Er 3+ sample was transformed to the monoclinic phase when the annealing temperature was increased from 600 to 1200 °C. We simultaneously found a significant enhancement of upconversion luminescence intensity during the crystalline phase transformation. On the basis of these results, further investigation can be carried out to achieve highly transparent ceramics with upconversion luminescence.
The upconversion luminescence integral intensities of the ZrO 2 co-doped 1 mol% Er 3+ and 18 mol% Yb 3+ sample increased by a factor of about 2.3 compared with that of the ZrO 2 doped 1 mol% Er 3+ sample. The spectral region of upconversion luminescence of (Er 3+, Yb 3+)-doped and (Er 3+/Yb 3+) co-doped ZrO 2 nanopowder was determined from the infrared excitation wavelength.
Acknowledgments
L T K G would like to thank the laboratory of Nanomaterials and Composite of IHPP, Poland, which hosted her during this research. Many thanks go to Professor Wiesław Strek for discussion and measurement. Thanks also go to Ewa Grzanka for the XRD measurements, Piotr Dłużewski for the TEM images and Adam Watras and Nguyen Thi Thanh Ngan for the luminescence measurements. This work was done as a part of the joint project of Professor Witold Lojkowski (IHPP, Poland) and Professor Le Quoc Minh (IMS, Vietnam) for optoelectronic nano-oxides and their application. This work was partly supported by the National Key Laboratory for Electronic Materials and Devices, Institute of Materials Science, Vietnam Academy of Science and Technology.