
Abstract
Antisense oligonucleotide to NF-κB sequence: 5'-GGA AAC ACA TCC TCC ATG-3', was microencapsulated in an albumin matrix by the method of spray dryingTM. Spectral analysis was performed on varying drug loading formulations of both drugs by mid-IR attenuated total reflectance-Fourier transform infrared spectroscopy (ATR-FTIR). An out of plane O–H bending vibration at 948 cm−1, unique to both the native and microencapsulated drugs was identified. The calculated peak areas corresponded to the drug loadings in the microsphere formulations. A standard curve could then be used to determine the drug content of an unknown microsphere formulation. Accuracy and precision were determined to be comparable to other analytical techniques such as HPLC.
Export citation and abstract BibTeX RIS

Content from this work may be used under the terms of the Creative Commons Attribution 3.0 licence. Any further distribution of this work must maintain attribution to the author(s) and the title of the work, journal citation and DOI.
1. Introduction
Antisense oligonucleotides to NF-κB have been shown to mitigate the pathophysiology of experimental septic shock [1–5]. The therapeutic potential of antisense oligonucleotides to NF-κB and thus, tumor necrosis factor has been limited by inadequate intracellular permeability [6]. Microencapsulation has been performed within a non-immunogenic, biodegradable bovine serum albumin (BSA) matrix in a 1.0–8.0 μm size range [7–10]. This formulation was optimal for phagocytosis, [11]. The antisense oligonucleotides to NF-kB were added to a cross-linked BSA solution to achieve 5, 10 and 15% microsphere drug loading [6]. Spray drying was performed using a Büchi 191 mini spray drying with parameter settings for optimum drug microencapsulation and yieldTM [3, 12, 13].
The microencapsulation of biopharmaceuticals such as proteins, peptides and oligonucleotides in a biodegradable polymer matrix provides for a method of controlled release delivery system [14, 15].
Microencapsulation enhances endocytotic cell uptake and also protects the biopharmaceutical drugs from enzymatic degradation [11, 14, 16, 17]. Microencapsulation of oligonucleotides such as the antisense to NF-κB presents a challenge with respect to the determination of drug content and, consequently, encapsulation efficiency and formulation consistency. The consistency of a pharmaceutical formulation preparation is critical to active pharmaceutical ingredients (API) performance. The bioavailability and release profiles of the pharmaceutical formulation are dependent on the formulation's consistency. Although, HPLC analysis has been used for determining the content analysis, we are trying to explore the use of attenuated total reflectance Fourier transform infrared spectroscopy (ATR-FTIR) to monitor and quantify the microencapsulated oligonucleotide drug.
A solid-state analytical technique utilizing ATR-FTIR was developed [18–20]. Mid-IR spectroscopy is an example of a vibrational spectroscopic technique. Mid-IR spectroscopy is sensitive to functional groups in molecules, with each functional group producing a specific vibrational pattern. The resultant IR spectrum is unique for each molecular structure [19]. The sensitivity of mid-IR is such that the IR spectrum produced is representative of the functional groups and structural interaction of molecules within a compound as well as the concentration of the molecule [19].
For quantitative analysis, antisense to NF-κB oligonucleotide in albumin solid microsphere formulations of known oligonucleotide concentrations was prepared. Infrared spectra of each standard were collected from the samples. Principal component analysis (PCA) of the sample spectra data and multivariate analysis were used to determine the influence of oligonucleotide concentration in the formulations on spectra [20–22]. A specific absorption band unique to the neat drug (non-encapsulated) oligonucleotide and microencapsulated oligonucleotide, but absent in the blank (non-oligonucleotide containing) albumin microspheres was identified. The peak areas were calculated for the various standards. A standard curve of corrected peak area versus microencapsulated oligonucleotide concentration was generated [22].
To the best of our knowledge, use of ATR-FTIR as a method of quantification of microencapsulated oligonucleotide has not been reported elsewhere. This paper will demonstrate the methodology involved developing ATR-FTIR as a process analytical technology (PAT) for content analysis of microencapsulated oligonucleotide formulation. The formulation process will be described along with the sample handling, data acquisition and processing.
2. Experimental
2.1. Chemicals
Bovine serum albumin (BSA) and sterile deionized water were purchased from Thermo Fisher, Waltham, MA. Antisense oligonucleotide to NF-κB was purchased from TriLink Bio Technologies, San Diego, CA.
2.2. Preparation of antisense oligonucleotide to NF-κB microspheres
Samples of antisense oligonucleotide to NF-κB in albumin microspheres were prepared for this investigation. Calibration samples were formulated over the range of analytical interest [23]: 0, 5, 10 and 15% (w/w) with respect to albumin. Drug loading of antisense oligonucleotide to NF-κB was formulated in a 5% w/v albumin matrix by the method of spray dryingTM. The solutions were spray dried using a Büchi Mini Spray Dryer (Model 191B, Büchi, Flawil, Switzerland). The process parameters were: inlet temperature = 110 °C, outlet temperature = 57 °C, flow = 800 psi, aspirator = 55%, and pump feed rate = 5%TM. The 0% drug loading, blank microspheres were obtained using the same procedure except no drug was added.
A reference sample of pure, non-encapsulated, solid antisense oligonucleotide to NF-κB was used to represent a 100% (w/w) antisense: BSA sample. Homogeneity of the formulations was ensured by stirring the antisense and albumin mixture in sterile deionized water for 10 min prior to the spray drying process.
2.3. Data acquisition
Sample FTIR spectra of antisense oligonucleotide to NF-κB microsphere were collected with a Bomen mid-infrared spectrophotometer using a Harrick Split Pea™ horizontal reflection ATR with a silicone ATR crystal. Data were reported using Unscrambler version 9.6 CAMO Software Inc., One Woodbridge Center, Suite 319, Woodbridge, NJ 07095, USA. Microsphere sample aliquots of 5–10 mg were placed onto the ATR and spectra collected without additional sample preparation. Spectra were collected over a spectral range 4000–600 cm−1 using a resolution of 8 cm−1 and 64 scans. Four microsphere sample aliquots were analyzed for each antisense oligonucleotide to NF-κB microsphere standard.
3. Results and discussion
ATR-FTIR full spectra of the pure antisense, antisense microspheres and blank microspheres were collected. The equation describing the depth of beam penetration for ATR is as follows:
depth of penetration (Dp) depends on the wavelength (directly) and the refractive indices of the crystal (natr) and sample (nsample).
Full spectra ATR and baseline correction was performed. nsample can vary depending on the sample composition. ATR correction transforms spectra collected by ATR into those resembling standard transmission spectra. ATR correction accounted for sample-to-sample biases caused by different beam depths of penetration related to refractive index variations with concentration. Baseline correction simply smoothed the baseline for quantization.
The spectra for the pure antisense-NF-κB and blank BSA microspheres are displayed in figure 1. A clear dependence on the antisense-NF-κB was shown in the spectra in the fingerprint region range of 974–915 cm−1, with a peak at approximately 948 cm−1. The pure antisense-NF-κB and blank BSA microsphere spectra were then deconvoluted with respect to the carboxylic acid group, out-of-plane O–H bend, at 974–915 cm−1 as shown in figures 2 and 3. Deconvolution was used to resolve the peaks within this fingerprint region.

Figure 1. Overlay spectra of non-encapsulated antisense-NF-κB and blank BSA microspheres. The spectra were acquired using a Perkin Elmer System 2000 FTIR with a silicone ATR crystal. ATR and baseline correction were performed using Spectrum software. A clear dependence on the antisense-NF-κB was shown in the spectra in the fingerprint region range 974–915 cm−1, with a peak at approximately 948 cm−1.
Download figure:
Standard image High-resolution image
Figure 2. Blank BSA microsphere spectrum deconvoluted with respect to the carboxylic acid group. Data was reported using Unscrambler version 9.6 CAMO software. Deconvolution was used to resolve the peaks within this fingerprint region. The –COOH peak at 915–975 cm−1 was absent in the deconvoluted blank spectrum and specific in this instance to the antisense-NF-κB.
Download figure:
Standard image High-resolution image
Figure 3. Pure antisense-NF-kB spectra deconvoluted with respect to the carboxylic acid group. The –COOH peak at 915–975 cm−1 was present in the deconvoluted antisense-NF-κB.
Download figure:
Standard image High-resolution imageAn antisense-NF-κB microsphere formulations sample set (0–15% antisense-NF-κB loading) was analyzed as shown in figure 4. The calibration sample spectra correlated to antisense-NF-κB concentration of antisense-NF-κB microsphere formulations sample. Full spectra were then analyzed by a standard deviation of mean absorbance as shown in figure 5. The standard deviation of mean absorbance at each wave number of the spectra allowed the identification of peaks showing the most significant differences between the formulations. The narrower was the standard deviation of mean absorbances, the more significant were the differences in peak areas between the formulations of different concentrations. The peak at approximately 948 cm−1 increased in intensity with increased loading of antisense-NF-κB in the albumin microspheres.
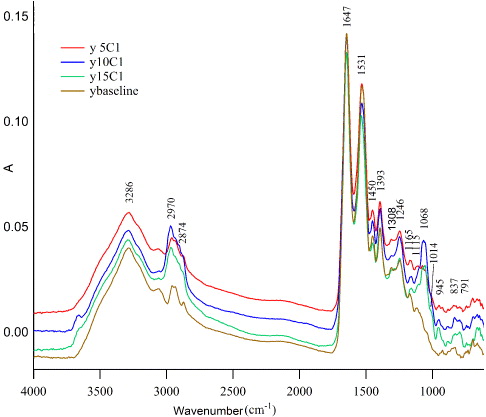
Figure 4. Overlay full spectra of antisense-NF-κB in albumin microsphere formulations. A clear dose-dependence on the antisense-NF-κB was shown in the peak at 915–974 cm−1. This –COOH peak was absent in the blank BSA microspheres.
Download figure:
Standard image High-resolution image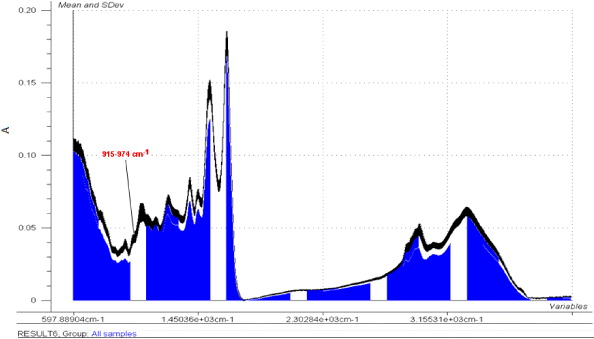
Figure 5. The standard deviation (SD) of mean absorbance of antisense oligonucleotide to NF-κB standards. The calibration sample ATR-FTIR data was processed using Unscrambler version 9.6 CAMO software. The SD of the mean absorbance of each NF-kB ms formulation at each wave number of the spectra was determined. The peak showing the most significant difference between the formulations: 0, 5, 10 and 15% w/w with respect to albumin drug loading of antisense oligonucleotide to NF-κB was determined. The absorbances (A) of this peak were used to produce the standard calibration curve.
Download figure:
Standard image High-resolution imageThe antisense-NF-κB microsphere formulations sample set peak areas for the carboxylic acid group, out-of-plane O–H bend, at 974–915 cm−1 were calculated as shown in table 1. These peak areas were then used to develop a quantitative method for predicting antisense-NF-κB content in albumin microsphere formulation samples. A standard curve of the peak area against antisense-NF-κB percentage loading in albumin microspheres is shown in figure 6. The calibration plot of the peak areas against per cent antisense-NF-κB loading was linear with a correlation coefficient (R2) value of 0.9674 and a sample mean standard error of less than 1 confirming the high precision of this analytical technique.

Figure 6. Standard curve of antisense NF-κB microsphere formulation calibration samples. Antisense NF-κB microsphere formulation calibration samples of 0, 5, 10 and 15% w/w loading were analyzed using ATR-FTIR to generate peak area values. The corrected peak area between 915 and 974 cm−1 for each antisense NF-κB microsphere formulation was calculated plotted against its corresponding percentage loading. The standard curve's linearity and slope were determined. A correlation coefficient (R2) value of 0.9674 was obtained indicating the accuracy of ATR-FTIR as a quantization tool for antisense NF-κB in Albumin microsphere formulations.
Download figure:
Standard image High-resolution imageTable 1. Validation-precision ATR-FTIR calibration samples. Validation-precision samples of antisense NF-κB microsphere formulations were analyzed by ATR-FTIR. The peak areas between at 915 and 974 cm−1 were calculated using Spectrum software. The data was used to produce a calibration curve for quantization of NF-κB in albumin microspheres.
| NF-κB loading (%) | Sample 1 | Sample 2 | Sample 3 | Sample 4 | Sample 5 | Average Corrected area | SD | SE |
|---|---|---|---|---|---|---|---|---|
| 0 | 0.002 | −0.0035 | 0.0086 | −0.0011 | −0.0129 | −0.001 | 0.01 | 0.0002 |
| 5 | 0.069 | 0.080 | 0.080 | 0.088 | 0.087 | 0.081 | 0.01 | 0.0002 |
| 10 | 0.087 | 0.082 | 0.124 | 0.157 | 0.130 | 0.116 | 0.03 | 0.0010 |
| 15 | 0.206 | 0.255 | 0.243 | 0.229 | 0.180 | 0.223 | 0.03 | 0.0009 |
| 100 | 0.621 | 0.695 | 0.708 | 0.602 | 0.627 | 0.650 | 0.05 | 0.0015 |
Antisense-NF-κB microsphere formulations of 0, 2.5, 5.0, 7.5, 8.5, 10 and 12.5% loading were prepared as verification samples. The verification sample spectra were collected and peak areas collected at 974–915 cm−1 as shown in table 2 and plotted as in figure 7. The verification plot of actual versus predicted antisense to NF-κB percentage loading in albumin microspheres gave a correlation coefficient (R2) of 0.984, a mean sample standard error and co-efficient of variance less than 1, figure 7. The antisense-NF-κB per cent loading in albumin microspheres in the verification samples was predicted to be within 2% (w/w) of the actual value.

Figure 7. Validation plot of actual versus predicted values. Per cent antisense-NF-κB microsphere loading using ATR-FTIR generated peak area values. The plot of actual versus predicted values gave a correlation coefficient (R2) value of 0.984 and a standard error of 0.601. The linearity further supported the precision of the ATR-FTIR analysis for antisense-NF-κB. The antisense-NF-κB per cent loading in albumin microspheres in the verification samples was predicted to within 2% w/w of the actual value.
Download figure:
Standard image High-resolution image
Table 2. Statistical analysis of the correlation between the peak areas and the concentration of antisense-NF-κB in albumin microspheres in the calibration samples. ATR-FTIR analysis gave relative standard deviation values of 18.7, 14.3 and 7.1% for the 5.0, 10.0 and 15.0% calibration samples, respectively. The standard errors of the slope and intercept of ±0.06 and ±0.003, respectively, indicating precision of the analysis.
| Replicates | AS loading 5% w/w | AS loading 10% w/w | AS loading 15% w/w |
|---|---|---|---|
| 1 | 5.226 | 12.660 | 13.763 |
| 2 | 5.633 | 11.847 | 16.028 |
| 3 | 4.623 | 9.408 | 14.228 |
| 4 | 5.865 | 12.195 | 13.647 |
| 5 | 3.542 | 14.170 | 15.331 |
| Mean (%) | 5 ± 19 | 12 ± 14 | 15 ± 7 |
| Variance | 0.866 | 2.977 | 1.080 |
| SD | 0.931 | 1.725 | 1.039 |
| % RSD | 18.698 | 14.312 | 7.119 |
| Mean of slope | 1.414 | ||
| Std Deviation (slope) | 0.151 | ||
| Std error (slope) | 0.0606 | ||
| Std error (intercept) | 0.0027 |
AS: antisense; SD: standard deviation; RSD: relative standard deviation.
4. Conclusion
This study has demonstrated that mid-IR ATR-FTIR can be successfully used to quantify the antisense oligonucleotide to NF-κB in albumin microencapsulated formulations. In developing this ATR-FTIR method, several factors had to be considered.
Problems associated with the size and handling of the calibration samples were overcome by full spectra ATR and baseline correction. The calibration samples were critical in establishing a valid quantitative methodology. This was achieved by preparing microsphere samples that were both homogenous and contained drug loadings, adequate enough to produce a valid calibration curve.
The quantification method developed utilized the peak area for the carboxylic acid group, out-of-plane O–H bend, at 974–915 cm−1. A calibration plot of the peak areas against percent antisense-NF-κB loading was linear with a correlation coefficient (R2) value of 0.9674 and a sample mean standard error of less than 1%. The linearity indicated the accuracy of the ATR-FTIR analytical technique for albumin microencapsulated antisense-NF-κB quantization. Unbiased samples were prepared to verify the model. The verification plot of actual versus predicted values produced a correlation coefficient (R2) value of 0.984.
ATR-FTIR is an easy-to-use vibrational spectroscopic method which is a simple, rapid, non-destructive and reliable method for sample quantization. As a viable alternative to other solid state techniques such as NMR, equal to or better results than Raman ATR-FTIR can be expected. This procedure also allows for rapid analytical sample turnaround. With respect to oligonucleotide microencapsulation ATR-FTIR can provide a real-time in-process analytical tool to enable process validation.
Acknowledgments
This study was supported by Dr Carl W Oettinger from the Dialysis Clinics of Atlanta and Dr Martin J D'Souza at the College of Pharmacy and Health Sciences, Mercer University, Atlanta, GA.