
Abstract
Various composite materials of MnO2/C have been synthesized by electrochemical deposition and then used for the synthesis of lithium manganese oxide (LiMn2O4) spinel as a cathode material for lithium ion batteries. The structure and electrochemical properties of electrode materials based on MnO2/C, spinel LiMn2O4 and doped spinel LiNi0.5Mn1.5O4 have been studied. The influence of synthesis conditions on the structural and electrochemical properties of synthesized materials was investigated by x-ray diffraction (XRD), scanning electron microscopy (SEM), transmission electronic microscopy (TEM) and charge–discharge experiments. Some of the studied materials exhibit good performance of cycling and discharge capacity.
Export citation and abstract BibTeX RIS

Content from this work may be used under the terms of the Creative Commons Attribution-NonCommercial-ShareAlike 3.0 licence. Any further distribution of this work must maintain attribution to the author(s) and the title of the work, journal citation and DOI.
1. Introduction
Lithium metal oxides are promising cathodic materials for lithium batteries. In comparison with layered LiCoO 2 and LiNiO 2, lithium manganese oxide (LiMn 2 O 4) is more attractive as Mn is cheaper and less toxic compared to currently chosen Co and Ni. Many manganese dioxide polymorphs are known, including layered and tunnel structures. Two manganese dioxides of particular interest to the battery industry are α-MnO 2 and γ-MnO 2 for 3 V primary cells [1]. Electrodes consisting of an intergrowth structure of lithiated α-MnO 2 and spinel-related MnO 2 are used in commercial 3 V rechargeable cells, and lithium manganese oxide spinel compounds Li x Mn 2 O 4 (0<x⩽1) are being developed for 4 V rechargeable cells [2]. However, manganese oxide electrodes for 3 V rechargeable cells tend to be limited by the anisotropic expansion and contraction of the crystallographic unit cell when lithium is inserted into, and removed from, α-MnO 2 or spinel-related structured electrode materials. In addition, the spinel-type LiMn 2 O 4 used for 4 V rechargeable cells presents the same problems as α-MnO 2, related to poor electrochemical stability [2, 3]. Crystallographic instability in lithium manganese oxides can be attributed to the Jahn–Teller effect, where the concentration of Mn 3+ ions within the oxygen array reaches a critical value, typically when the mean oxidation state of manganese falls below 3.5 [4]. In recent years, much work has focused on the improvement of cyclic performance by reducing the Mn 3+ ion content [5] and the increase in cell voltage by doping other transition metal cations, such as Ni, Co and Cr, which can make the structure of spinel LiMn 2 O 4 more stable [6–8]. Moreover, some authors have found that the capacity lost at the 4 V plateau in LiNi x Mn 2−x O 4 reappears on a higher voltage plateau (4.7 V) [9] due to the valence variation of Ni. LiNi x Mn 2−x O 4 shows higher energy density and operating voltage than LiMn 2 O 4, making it the most attractive material for practical application [10].
In order to improve the electrochemical properties (cycling stability, charge/discharge capacity) of electrode materials, all of the factors related to their synthesis, such as stochiometry, crystal structure and morphology of the active materials, need to be investigated. Recently, several effective synthesis methods have been proposed to modify the structural properties; for example, using the non-crystalline manganese oxide [11, 12] mesoporous structured or nanostructured materials, composite MnO 2/nanostructure carbon, and doping LiMn 2 O 4 with transition metal (M=Co, Ni. Fe, etc) [13].
In this paper, with the aim of stabilizing or modifying MnO 2 and lithium manganese oxide structures for lithium battery cathode materials, we have focused on composite MnO 2/C nanostructured, spinel LiMn 2 O 4 and doped spinel LiNi 0.5 Mn 1.5 O 4 materials. The materials were analyzed in terms of their structure and electrochemical properties.
2. Experimental
2.1. Synthesis procedures
2.1.1. MnO2/C nanostructured composite materials
The MnO 2 film or MnO 2/C composite materials were electrochemically deposited on the graphite substrate. The synthesis procedure has been reported elsewhere [14, 15]. Here, the different carbon additives were used to modify MnO 2 properties, such as carbon nanotube (SUNANO-China), carbon nano liquid (17%, Saigon High Tech Park), black carbon, graphite carbon (PINACO Con O company) and carbon slurry (SAIGONMIC company).
2.1.2. Spinel LiMn2 O4 materials
To prepare LiMn 2 O 4 spinel, a solid state reaction is suitable for laboratory conditions and industrial manufacture. Stoichiometric amounts of LiNO 3 and MnO 2 were first mixed by grinding and then annealed at different temperature steps [16]. The MnO 2 source varied from electrochemical manganese dioxides (EMD, 91%, supplied by PINACO Con O battery factory), thermal treated EMD (EMDt) and chemical manganese dioxide (CMD). The CMD compound was prepared in the laboratory, as reported in our previous study [15].
2.1.3. Ni doped spinel LiNix Mn2-x O4 (x=0.4 and 0.5)
The compositions were also prepared by a solid state reaction. The starting reagents were Li 2 CO 3 or LiCH 3 COO (Merck), Ni(CH 3 COO)2·4H 2 O (Prolabo) and MnCO 3 (Aldrich). Samples with appropriate stoichiometry ratios were mixed with mortar and pestle and fired initially in air at 600–700 °C for 20 h to decompose all of the carbonate, nitrate and acetates. The materials were then re-grounded, pressed into pellets and reacted repeatedly for 24 h at 900 °C, with furnace cooling (about 200 °C h −1).
2.2. Property characterization
2.2.1. Structure and morphology characterization
The crystal structure of the products was characterized by x-ray diffraction (XRD, D8 ADVANCE–BRUKER, Germany; and XRD SIEMEN D8000) with Cu Kα radiation (λ=1.5406 Å) and Co Kα radiation (λ=1.7789 Å), respectively. Data were collected in the 2θ range from 10 o to 130 o with a step 0.02 o and counting time of 1s/step. Lattice parameters were determined by a least squares method (CELREF software). Structural parameters were determined from powder diffraction data by the Rietveld method with the WinplotR/Fullprof package. The morphology and the distribution of the grain size were determined using a LEO S440 scanning electron microscopy (SEM) instrument equipped with energy-dispersive x-ray (EDX) spectroscopy analysis or using a JSM 6480LV SEM (Jeol Co., Japan). Transmission electronic microscopy (TEM, JEM 1010, Jeol Co., Japan) was performed for the samples of MnO 2/C composite materials. Raman spectroscopy (RS) measurements were carried out with a Renishaw Invia Raman Spectrometer. Spectra were recorded with the red line of a laser diode (785 nm) in the micro-Raman configuration (objective×50).
2.2.2. Electrochemical measurements
Cyclic voltammetry measurements were first performed for all of the synthesized electrode materials using the Autolab PGSTAT30 instrument. Except for MnO 2/C composite materials, the LiMn 2 O 4 powder or LiNi x Mn 2−x O 4 was mixed with acetylene black and polytetrafluoroethylene (PTFE) (weight ratio 7 : 2 : 2), pasted on the aluminium foil and cut into pellets. The cell consisted of a working electrode (WE), a Pt wire as a counter electrode (CE) and a reference electrode (RE).
- In the case when the WE is a composite material, the counter electrode is Ni mesh 4×5 (cm 2). An aqueous solution of KCl 2 M was used as the electrolyte. The measurement was carried out in a potential window of 0–1 V with a scan rate of about 5 mV s −1.
- When the WE materials are based on LiMn 2 O 4, the reference electrode is a saturated calomel electrode (SCE). An aqueous solution of LiOH was used as the electrolyte. Cyclic voltammetry was performed in the voltage range from −0.4 to 1.0 V (SCE) at a potential sweep rate of 50 mV s −1.
- For the doped spinel WE, the reference electrode consists of a silver wire immersed in 0.1 mol l −1 tetrabutyl ammonium perchlorate (TBAP) solution dissolved in acetonitrile within 10 mmol l −1 AgNO 3. The potential of this reference electrode is 0.548 V versus a standard hydrogen electrode (SHE). The electrolyte is a 1 M solution of lithium hexafluorophosphate (LiPF 6) in a solvent mixture of ethylene carbonate and dimethyl carbonate (EC-DMC) (50 : 50 volume ratio). The measurement was carried out in a potential window of 3.5–4.8 V with a scan rate of about 30 μV s −1.
A charge/discharge cycling test for Swagelok-type batteries was carried out in liquid electrolyte at room temperature. Cathodic pastes were prepared by intimately mixing the oxide powder (LiMn 2 O 4 or LiNi x Mn 2−x O 4) with carbon black and PTFE emulsion in the weight ratio of 70 : 20 : 10. This paste was then rolled down to 0.1 mm thickness, cut into pellets of 10 mm diameter and dried at 130 °C under a vacuum. Typical active material masses used were 15–20 mg cm −2. The electrolyte was a 1 M solution of LiPF 6 in EC-DMC 1 : 2 (Merck Co.). Negative electrodes were 200 μm thick lithium foil (Metall Ges., Germany). Cells were assembled in a glove box under argon with ⩽2 ppm H 2 O. Electrochemical studies were carried out using a MacPile Controller (Bio-Logic, Claix, France) in the potential window 3.50–4.85 V versus Li/Li + (for the Ni doped spinel) and 2.8–4.2 V (for the LiMn 2 O 4 spinel), in either galvanostatic mode at the C/20-C/25 regime, or by step-potential electrochemical spectroscopy (SPES), using 10–20 mV 1 h −1 steps, typically.
3. Results and discussion
3.1. Composite MnO2/C nanostructured electrode
First, the MnO 2 ·nH 2 O was deposited on the graphite substrate from manganese acetate solution. Here we investigated the morphology and charge/discharge rate of the MnO 2 pure electrode deposited at different current densities i [15]. From the voltammogram curves, the highest capacitance was obtained at i=0.2 mA cm −2. The SEM and TEM images showed high porosity structure and small particle size of about 30–70 nm (figure 1). As reported previously in our study, deposited MnO 2 has an amorphous structure due to the peak broadening and its weak intensity.

Figure 1 SEM images of MnO 2 deposited on the graphite substrate at different current densities (a) 0.2; (b) 0.4; (c) 0.6; (d) 1.0 mA cm −2. TEM images of MnO 2 deposited at i=0.2 mA cm −2: (e) surface, (f) cross-section area.
In the potential window of 0–1 V, there is no oxidation-reduction peak on the voltammogram. The capacitance for charge, discharge and the complete cycle can be calculated from the electric quantity determined from the curve [15]. At high electrodeposition current density, MnO 2 formed quickly on the graphite substrate and tended to come down in the solution. In addition, the fast precipitation of the product gives inhomogeneity and decreases the porosity of the surface. Thus, the electrode capacitance slowed down quickly. In fact, the electrochemical properties of the electrode depend mainly on several factors, such as the specific surface area (including the homogeneity, the porosity and the particle size), the material conductivity and the adsorption capacity, which determined the electron transfer process.
The carbon additives (C graphite, carbon nanotube, etc) were added directly to the solution of manganese acetate to obtain the electrode composite MnO 2/C. The electrodeposition was performed at a current density of about 0.2 mA cm −2. Table 1 shows the average capacitance of the charge/discharge cycle calculated from the cyclic voltammogram (CVs) of different composite electrodes between 0 and 1 V versus SCE, taken at a sweep rate of 5 mV s −1. Compared to the pure MnO 2 electrode, the modified MnO 2 electrodes exhibit an average capacitance increase, except for the C graphite and C black . Interestingly, the largest capacitance was obtained in the case of C slurry . Here, SEM and TEM images (figure 2) showed the high porosity surface composite MnO 2/C slurry . The integration of slurry carbon in the MnO 2 structure increases the material conductivity, and therefore the charge accumulation and accessible charge transfer were improved enormously.

Figure 2 TEM image of composite electrode MnO 2–C sl (left) and SEM image of carbon slurry C sl (right).
Table 1. Capacity of the MnO 2 electrode modified by carbon additives (in parentheses is the particle size of carbon).
| MnO 2 | 116.0 |
| MnO 2–C gr (3–4 μm) | 79.6 |
| MnO 2–C bl (1 μm) | 83.3 |
| MnO 2–C NT (>10 nm) | 127.1 |
| MnO 2–C NL (>100 nm) | 134.0 |
| MnO 2–C sl (>100 nm) | 144.4 |
| MnO 2–NiSO 4 | 143.1 |
In terms of electrode materials used in rechargeable cells, the cyclability and charge/discharge capacity stability are important factors. The cycling test was realized for a composite MnO 2/C slurry electrode. After 600 cycles, the charge and discharge capacity did not change significantly (figure 3) and the coulombic efficiency is about 97.8%. Compared to other cathode materials recently used in lithium batteries, such as LiNi 0.5 Co 0.25 Mn 0.25 O 2 [16], LiNi 0.2 Co 0.6 Mn 0.2 O 2 [17] and LiCr 0.2 Mn 1.8 O 4 [18], the composite MnO 2/C slurry was a promising candidate.

Figure 3 Charge/discharge capacity of electrode composite MnO 2/C sl during the cycling test.
3.2. Spinel material LiMn2 O4
Figure 4 shows the XRD patterns with radiation Cu Kα of the spinel prepared from different MnO 2 sources (EMD, EMD t and CMD). The diffraction patterns of three samples were similar, with all of the indexable peaks in the Fd-3m space group with a cubic lattice. The spinel LiMn 2 O 4 prepared from EMD (M1) and EMD t (M2) had the same peak at 2θ=45 o , 65 o and 78.2 o of cubic Mn 2 O 3 impurities (JCPDS 01-071-0636) while spinel LiMn 2 O 4 prepared from CMD (M3) did not contain these impurities. As the MnO 2 raw materials did not contain Mn 2 O 3, the latter was formed in the spinel synthesized process of M 1 and M 2. From the XRD data, the lattice parameter was calculated using CELREF-refinement software and it is shown in table 2.

Figure 4 XRD patterns of spinel prepared from M1 (EMD), M2 (EMD t ) and M3 (CMD).
Table 2. Lattice parameters of spinel LiMn 2 O 4 materials prepared from different MnO 2 sources.
| 8.2476 Å | 8.2102 Å | 8.2351 Å | 8.2448 Å |
It is obvious from table 2 that the lattice parameter ao of the LiMn 2 O 4 spinel prepared from EMD t was the largest and it is quite equal to the standard LiMn 2 O 4. The spinel prepared by the CMD source surprisingly exhibits the smallest lattice parameter, 8.2102 Å. In fact, Strobel et al [3] reported the low value in the case of the spinel phase formed with β-MnO 2 at less than 600 o C of about 8.209 Å. This is indeed our prepared CMD and it has most diffraction peaks similar to the β-MnO 2 structure (table 3).
Table 3. XRD analysis of MnO 2 materials.
| EMD | EMD t | CMD | MnO 2 body- | β-MnO 2 | MnO 2 | Mn 2 O 3 |
| centered tetragonal | pyrolusite | ramsdelite | orthorhombic | |||
| 6.905 | 6.902 | 6.942/100 | 6.919/37 | |||
| 5.380 | ||||||
| 4.911 | 4.905/77 | 4.895/53 | ||||
| 3.978 | 4.072 | 4.055 | 4.023/100 | |||
| 3.139 | 3.105 | 3.103/38 | 3.093/82 | |||
| 2.769/65 | ||||||
| 2.508 | 2.549/35 | 2.521/100 | ||||
| 2.380 | 2.421 | 2.389 | 2.388/42 | 2.395/100 | ||
| 2.326/30 | ||||||
| 2.110 | 2.133 | 2.220/35 | ||||
| 1.930 | 1.829 | 1.826/20 | 1.827/50 | |||
| 1.617 | 1.626 | 1.632 | 1.720/75 | |||
| 1.459 | 1.550 | 1.534/58 | 1.450/45 |
The morphology of the spinel products strongly depends on that of the starting MnO 2 raw materials (figure 5). SEM images of LiMn 2 O 4 prepared from EMD and EMD t revealed the formation of irregular particles with a broad particle size distribution from 0.1 μm to 10 μm (M2) and 0.1 μm to 7 μm (M1). In addition, small M1 and M2 particles aggregated to form bigger blocks that resemble the shape of the starting materials, EMD and EMD t , respectively. In contrast, the M3 particles were uniform in spherical shape and had dimensions of 0.5 to 3 μm.

Figure 5 SEM images of EMD (a), EMD t (b), CMD (c), M1 (d), M2 (e) and M3 (f).
The charge/discharge characteristics of the cathode were determined by the cycling test in the potential window 2.8–4.2 V versus Li/Li + and in galvanostatic mode in the C/20–C/25 regime. The discharge specific capacity Q s (d) in figure 4 was estimated by the following formula:
where M is the molar mass of LiMn 2 O 4 (g mol -1), Δx is the number of intercalated Li + ions per formula (number of transferred electrons per intercalated ion) and 26 802 is the Faraday number in mA h.
The cell with M1 cathode material showed no flat voltage region during the whole charge–discharge cycle, which leads to the suggestion that the M1 cathode had only the thickness variation of the double electric layer during the cycle from 2.9 to 4.4 V versus Li +/Li. By contrast, for the M2 and M3 cells, there were two flat voltage regions (versus Li +/Li) at 3.9 and 4.1 V, which means that electrochemical reactions occurred in the M2 and M3 cells: the Mn 3+/Mn 2+ at 3.9 V and Mn 4+/Mn 3+ at 4.1 V potentials (figure 6). The variation in the specific discharge capacity values of all three cells during the first ten cycles is presented in figure 7.
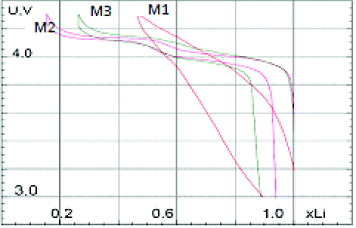
Figure 6 The potential number of exchange electrons curve for the first charge–discharge cycle.

Figure 7 Specific discharge capacity of spinel materials in simulated lithium-ion cells.
As can be seen clearly from figure 7, cell M2 (with LiMn 2 O 4 prepared from EMD t ) has the highest initial discharge capacity: about 120 mAh g −1. This value is quite good in comparison with literature data [19]. The largest initial discharge capacity may be explained by its lattice parameter. In comparison with M1 and M3, the M2 material (LiMn 2 O 4 spinel synthesized from EMD t ) has the largest and closest to the standard LiMn 2 O 4 lattice parameter (table 2).
The initial discharge capacity of M3 is larger than that of M1 (93 mAh g −1 and 63 mAh g −1, respectively) due to the influence of Mn 2 O 3 impurities in the M1 compound (figure 7). The presence of Mn 2 O 3 impurities may also be the reason for the quick capacity loss during repeated cycling for the M1 and M2 cells. The M3 cell exhibits the excellent capacity stability during the first ten charge–discharge cycles (figure 5). As reported previously, the good rechargeability and medium capacity would be obtained when the lattice parameter of the spinel phase lies between 8.234 and 8.314 Å [19]. Indeed, the spinel M3 had the smallest lattice parameter: 8.2102 Å.
3.3. Doped spinel material LiNix Mn2−x O4
The XRD powder spectra of LiNi x Mn 2−x O 4 samples (x=0.4 and 0.5) synthesized by a solid state reaction are shown in figure 8.

Figure 8 XRD patterns of spinel compounds LiNi x Mn 2−x O 4 (x=0.5 and x=0.4).
The diffraction patterns of the two samples were similar, with all indexable peaks ascribed to the spinel structure with a cubic lattice. The spinel lattice parameter of these phases was determined using Rietveld software (table 4). The diffractogram clearly shows the difference between LiNi 0.5 Mn 1.5 O 4 (two-phase) and LiNi 0.4 Mn 1.6 O 4 (single-phase). In the presence of a second spinel, all reflections should show additional shoulders; the detailed analysis of the curves in figure 8 shows that this is the case only for reflections with hkl indexes all even, i.e. not for the strong peaks 311 or 111 (not shown). The most plausible minor phase is therefore Ni 1−y Li y O with a cell parameter close to a spinel /2. In fact, the secondary phase was previously announced whenever the Ni concentration x in doped LiMn 2 O 4 was higher than 0.4 [19–23]. In addition, at a high Ni concentration, it is easy to give the secondary phase when we synthesized at the high temperature due to oxygen loss. The lattice parameter of the spinel phase decreases when the Ni concentration doped is high. Indeed, Ni introduction to the structure induces an increase in manganese valence, thus a diminution of corresponding cationic radius was obtained (r Mn 3+=0.64 Å, r Mn 4+=0.53 Å) [24].
Table 4. Experimental data LiNi x Mn 2−x O 4, Rietveld refinement in Fd-3m space group.
| 0 | 8.248 a | 0.2632(3) | 1.958(6) | – | – | – | – | – |
| 8.875(2) | ||||||||
| 0.4 | (8.89 b ) | 0.2647(6) | 1.934(4) | 1435 | 13.1 | 1.57 | 3.18 | 3.96 |
| 8.772(5) | ||||||||
| 0.5 | (8.74 c ) | 0.2619(7) | 1.952(6) | 3469 | 16.0 | 2.02 | 2.31 | 3.92 |
The presence of nickel in the rock-salt phase changes the stoichiometry of the main spinel phase, where it must be compensated by the other cations. Neglecting the lithium contribution to the stoichiometry changes for simplicity, the overall composition can be balanced as follows [25]:

The conservation of the overall Ni, Mn and Ni/Mn stoichiometries leads to
The difference from the stoichiometric ratio Ni:Mn=1 : 3 of the spinel phase induces a diminution of the manganese valence. Following the XRD data of LiNi
0.5
Mn
1.5
O
4, Retvield refinement based on two-phase results in 7.5% (in mol) of the secondary phase. From equation (
The spinel compound LiNi 0.5 Mn 1.5 O 4 has been reported to crystallize in two possible space groups: Fd-3m and P4332, corresponding to normal spinel (without B-site cation ordering) and 1 : 3 B-site ordered spinel, respectively [26–28]. The experimental evidence of the P4332 structure in XRD patterns is rather weak when B cations have neighboring atomic numbers, as is the case for Ni and Mn. However, this symmetry difference is easily recognized from vibration spectra (infrared or Raman) [26, 29, 30].
According to the crystal symmetry, a normal AB 2 O 4 spinel with space group Fd-3m (O h 7) has five Raman and six infrared active modes, while the ordered P4332 spinel has a much larger number of actives modes (42 Raman and 20 infrared) [31, 32]. This is well verified experimentally: figure 9 shows that the Raman bands in ordered LiNi 0.5 Mn 1.5 O 4 are much more numerous and sharper than in disordered LiNi 0.4 Mn 1.6 O 4.
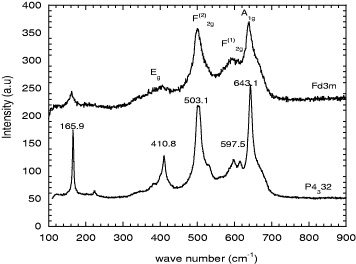
Figure 9 Raman spectroscopy of LiNi x Mn 2−x O 4 (x=0.4 and 0.5).
Figure 10 shows step-potential electrochemical spectroscopy (SPES) voltammetry scans of unsubstituted LiNi 0.5 Mn 1.5 O 4 and LiNi 0.4 Mn 1.6 O 4 versus lithium metal, all measured at the same potential sweeping rate. All show a main, reversible, high-potential reaction around 4.75 V versus Li/Li + and a slight capacity around 4 V, which is ascribed to the Mn 3+ fraction resulting from non-stoichiometry in the spinel phase. The main redox peak of Ni doped spinel phases is split into two components attributable to the Ni 2+/3+ and Ni 3+/4+ redox couples [33].
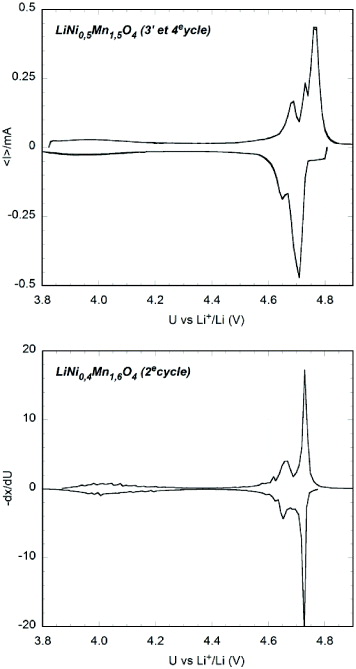
Figure 10 Slow-scanning SPES voltammetry of LiNi x Mn 2−x O 4 (3rd cycle, sweeping rate 10 mV h −1, data normalized to 0.1 mmol active material).
The LiNi 0.4 Mn 1.6 O 4 presents a discharge capacity higher than LiNi 0.5 Mn 1.5 O 4. In fact, the presence of a secondary phase in LiNi 0.5 Mn 1.5 O 4 is attributed mostly to the capacity diminution at high voltage. The result is quite similar to that reported by Le Cras et al [21]. However, compared with the spinel LiMn 2 O 4 prepared from EMDt, the capacity of Ni doped spinel LiMn 2 O 4 is a little higher than the latter, about 110 Ah kg −1 versus 105 Ah kg −1 for the thirtieth cycle. In addition, Ni doped LiMn 2 O 4 exhibits excellent cyclability due to the manganese valence increase, particularly the capacity discharge of LiNi 0.5 Mn 1.5 O 4 is still high expectedly, about 100 Ah kg −1 after 70 cycle charge–discharge at C/25 rate (figure 11).

Figure 11 Evolution of the capacity of LiNi 0.5 Mn 1.5 O 4 with cycle number.
4. Conclusions
In this study, we investigated cathode materials based on manganese oxides used for rechargeable cells. The MnO 2 modified by the carbon slurry (C sl ) additives presented interesting electrochemical behavior, such as high value capacitance and good cyclability. The LiMn 2 O 4 spinel prepared from different MnO 2 shows several still limited properties: low discharge capacity (M1 sample) and fast capacity fading with cycling (M2 sample). The M2 compound exhibits excellent cyclability, but discharge capacity is still low. So, it needs to be improved for use as a positive material in the lithium cell. The Ni doped spinels LiNi x Mn 2-x O 4 significantly improve the cyclability of LiMn 2 O 4 and also the discharge capacity. In addition, these materials give a discharge capacity not only at 4 V versus Li +/Li (involving redox couple of Mn 4+/3+) but also at 5 V versus Li +/Li due to the couple of Ni 4+/2+. The LiNi 0.5 Mn 1.5 O 4 presented a discharge capacity lower than LiNi 0.4 Mn 1.6 O 4 due to the presence of a rock-salt phase. The LiNi 0.4 Mn 1.6 O 4 seems to be the promising candidate as a material cathode for high voltage lithium batteries.
Acknowledgment
This work was supported by the Vietnam National University in Ho Chi Minh City through the Science and Technology Fund granted for the B2011-18-01 TD project.